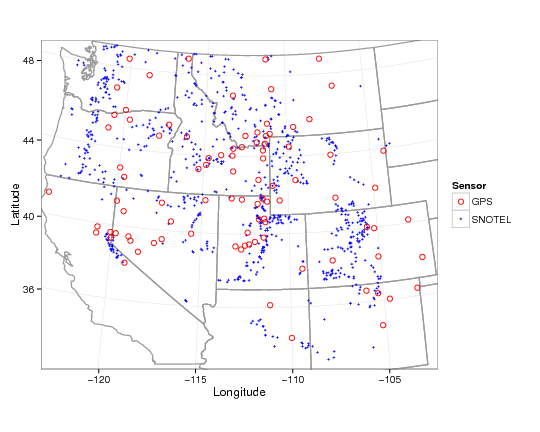
Snow measurements are needed both to study climate and to predict drought, flooding, and water availability. In urban areas, weather spotter networks and citizen scientists measure snow depth. However, information about snow depth is more difficult to obtain in remote areas that are sparsely populated. Measuring snow is also difficult because it is highly variable in space and time. The U.S. national snow network (SNOTEL ) (Figure 1) has a large number of sensors in the western United States, but these sensors have fairly small sensing regions (a few square meters). Satellites - which in principle would be able to provide the large picture - do not currently provide accurate estimates of snow depth.
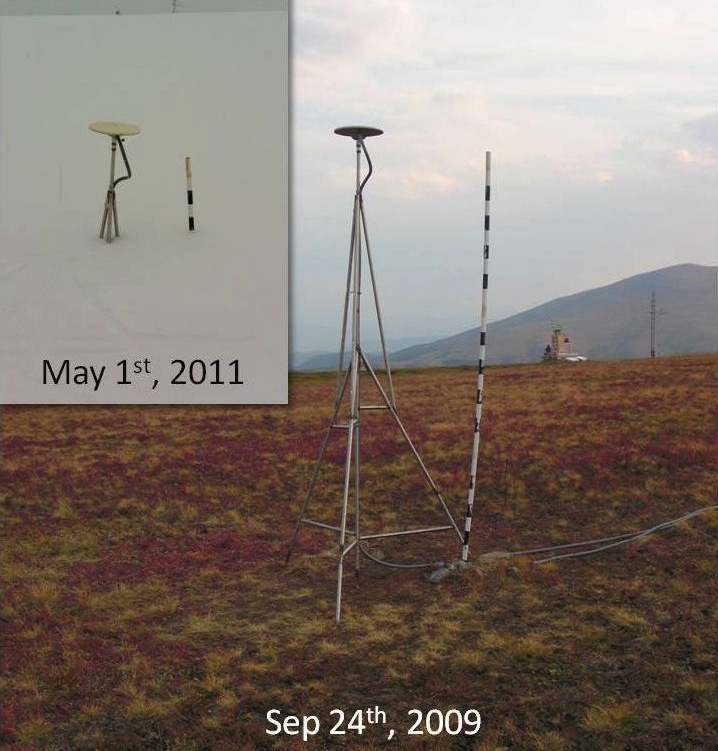
GPS is a new method to measure snow depth with a fairly large sensing region (circle of radius of 10 to 20 meters, Figure 2) PBO H2O now routinely measures snow depth in the western United States and Alaska. We have recently added a Snow Water Equivalent product, which means how high the water level would be if you melted the snowpack.


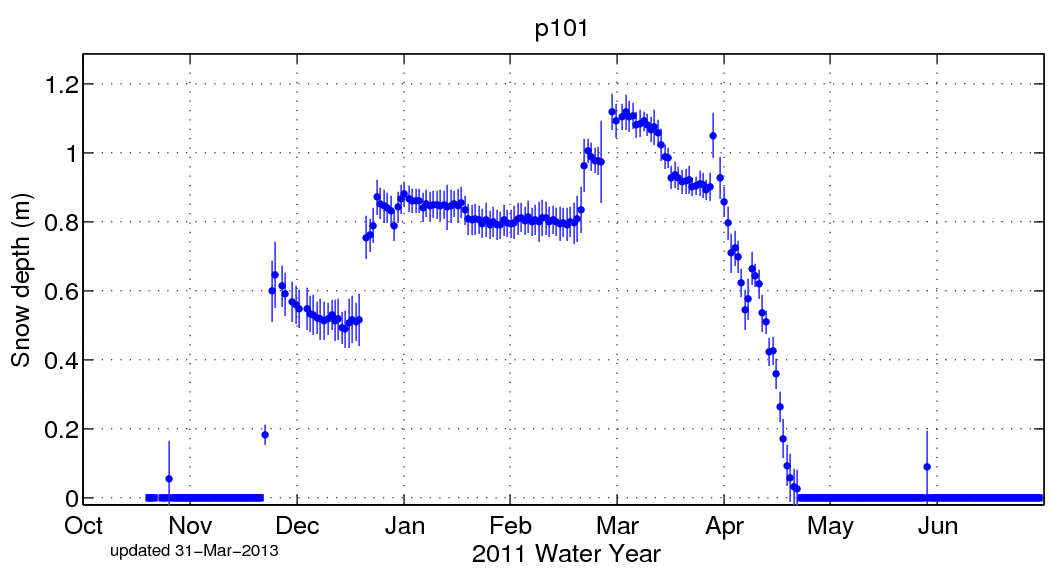
Here we show two views of a snow season. On top we show a photograph taken once a week at a GPS site in Idaho. You can get a sense for how much snow there is by looking at the brownish post next to the antenna. There little white marks indicate one foot intervals. Below the photos we show the time series of snow depth that is generated from the GPS data. You can see that when the snow level goes up in the photos, it also goes up in the time series. We then digitally measured snow depth from the photos. The agreement between the photos and the GPS sensor is excellent.
We use fluctuations in signal power caused by reflections to measure snow depth. On the left hand side of Figure 3, you see signal to noise ratio data (SNR) for three days at GPS site P101. These SNR data tell you about reflections from the surface below the GPS antenna. If the surface below the antenna is a snow layer, the SNR data indirectly measure snow depth. If the surface reflector (from the ground or the snow) is fairly flat, then the SNR data will be a sine wave. The frequency of that sine wave tells us how far away the reflector is—as snow depth increases, the surface reflector gets closer to the antenna and the period gets longer. We use a computer program called a Lomb Scargle Periodogram (LSP) to find those frequencies and that is what is plotted on the right. From the data you can see that when there is no snow, the reflector height is approximately 2 meters. As more and more snow falls, the LSP curves move to the left, meaning that the reflector is getting closer to the GPS antenna.
In Figure 4, we show the reflector heights for one satellite for an entire snow season. In the fall, the reflector height is about 1.9 meters. Then we can see snowstorms throughout the winter, with the smallest reflector height around March 1. Then the snow begins to melt and the reflector height returns to its value from the fall. In Figure 5 we show the snow depth value computed by the PBO H2O group, which is the average for 10 different satellite tracks.

Last modified: 2019-12-26 16:24:59 America/Denver


Please send comments and corrections to education unavco.org.
Copyright © 2012 - 2026 UNAVCO and the GPS Reflections Research Group.
All Rights Reserved.