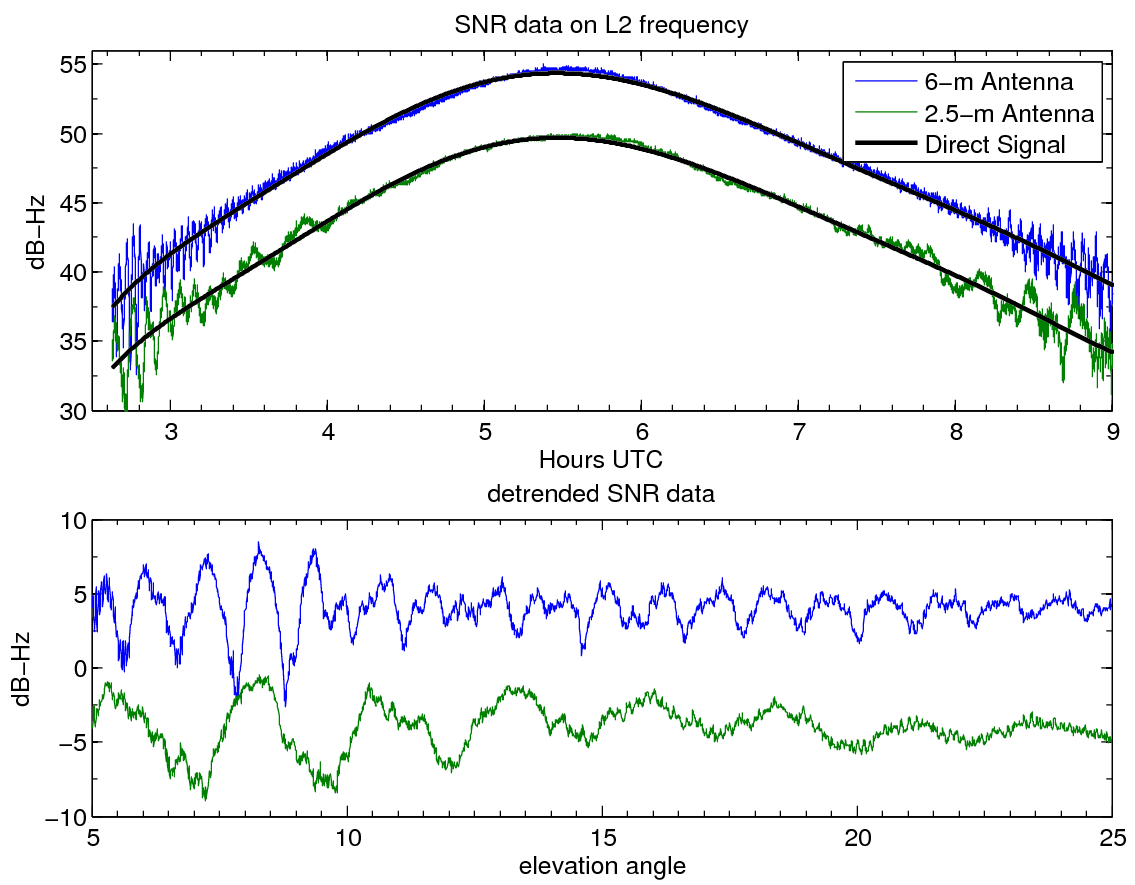
A GPS receiver measures signal strength or signal to noise ratio (SNR). The main part of SNR is the direct signal. This is shown in black in Figure 1. It is low at the beginning of the arc, rising to ~55 db Hz at its peak, then slowly decaying again. The oscillations seen at the beginning and end of the satellite arc are caused by the interference of the direct and reflected GPS signals. The frequency of the interference tells you how far the antenna is above the reflecting surface. You can see in the example below (the Oklahoma SMAP in situ testbed) that the 6-meter antenna has higher frequency SNR data than the 2.5-meter antenna.

Last modified: 2019-12-26 16:24:59 America/Denver


Please send comments and corrections to education unavco.org.
Copyright © 2012 - 2026 UNAVCO and the GPS Reflections Research Group.
All Rights Reserved.