GPS Data

Time Series and Velocity Vectors

Scientists generally use two tools to look at GPS data when studying tectonics: time series and velocity vectors. We'll use station CAT3, on Catalina Island off the coast of California, as an example.

Time Series

A time series is a graph that shows how positions change over time (Figure 1).

  • Each dot in a time series represents the position of the GPS site. Usually, there is one dot for each day.
  • Each dot has an uncertainty. To make the plots easier to read, we have not plotted the uncertainty on this website, but they are always provided in the position data file.
  • A dot is produced for each of three dimensions: north-south, east-west, and vertical (up-down).
  • The trend of the dots shows the direction of the GPS site's movement. If a line has a slope of zero, the site is not moving in that dimension.
  • The direction labeled on each plot is "positive." On the North plot, north is positive and south is negative. If the slope is positive, the site is moving northward. If the slope is negative, the site is moving southward.
  • The starting number on the plot doesn't matter. We aren't actually interested in where the site is—we're interested in how the site moves. We're always interested in the difference between one position and another, not the number associated with the position.
  • It is important to know the reference frame of the GPS data. In this case the positions are shown in the North America fixed reference frame.
  • For more help, check out UNAVCO's Reading Time Series Plots Reference Key.

Figure 1.Time series of site CAT3. A linear fit is shown in green. Each dot represents CAT3's position on one day. On the top plot, a positive slope indicates the site is moving north. A negative slope indicates the site is moving south. Similarly, a positive slope in the second plot indicates eastward movement and a positive slope in the bottom plot indicates the site is moving up.

Figure 2.The green slopes calculated in Figure 1 are used to plot the CAT3 velocity vector, 31.6 mm/yr to the north and 31.3 mm/yr to the west. The total motion (shown in red) is then plotted along with the other GPS stations of the Plate Boundary Observatory. The scale for the vectors is the black arrow in the lower left. All motions are shown in a North America fixed reference frame.

Velocity Vectors

A velocity vector is an arrow that shows direction and speed of motion of a GPS site. The velocity vector for each site shown in Figure 2 is calculated from data like those shown in Figure 1.

  • A vector is a mathematical construct that has a magnitude and a direction.
  • The magnitude of a velocity vector is the rate of motion, usually measured in millimeters per year.
  • The direction of a velocity vector usually shows only the horizontal velocity. A vector is described in three dimensions: east-west, north-south, and up or down. However, on maps like the ones shown here, we can only see two of these dimensions: north-south and east-west, which can both be shown with one arrow.
  • The GPS site is at the tail of the vector. The site is moving in the direction of the arrow. The longer the arrow, the faster the motion.
  • Figure 2 highlights the motion of two sites: CAT3 and P589. The data for CAT3 are shown in Figure 1; the data for P589 are provided here. Why is CAT3 moving so much faster than P589?

Classroom exercises:


Last modified: 2019-12-26  16:24:59  America/Denver  


Please send comments and corrections to educationunavco.org.

Copyright © 2012 - 2024 UNAVCO and the GPS Reflections Research Group.
All Rights Reserved.

Funding and Acknowledgements.
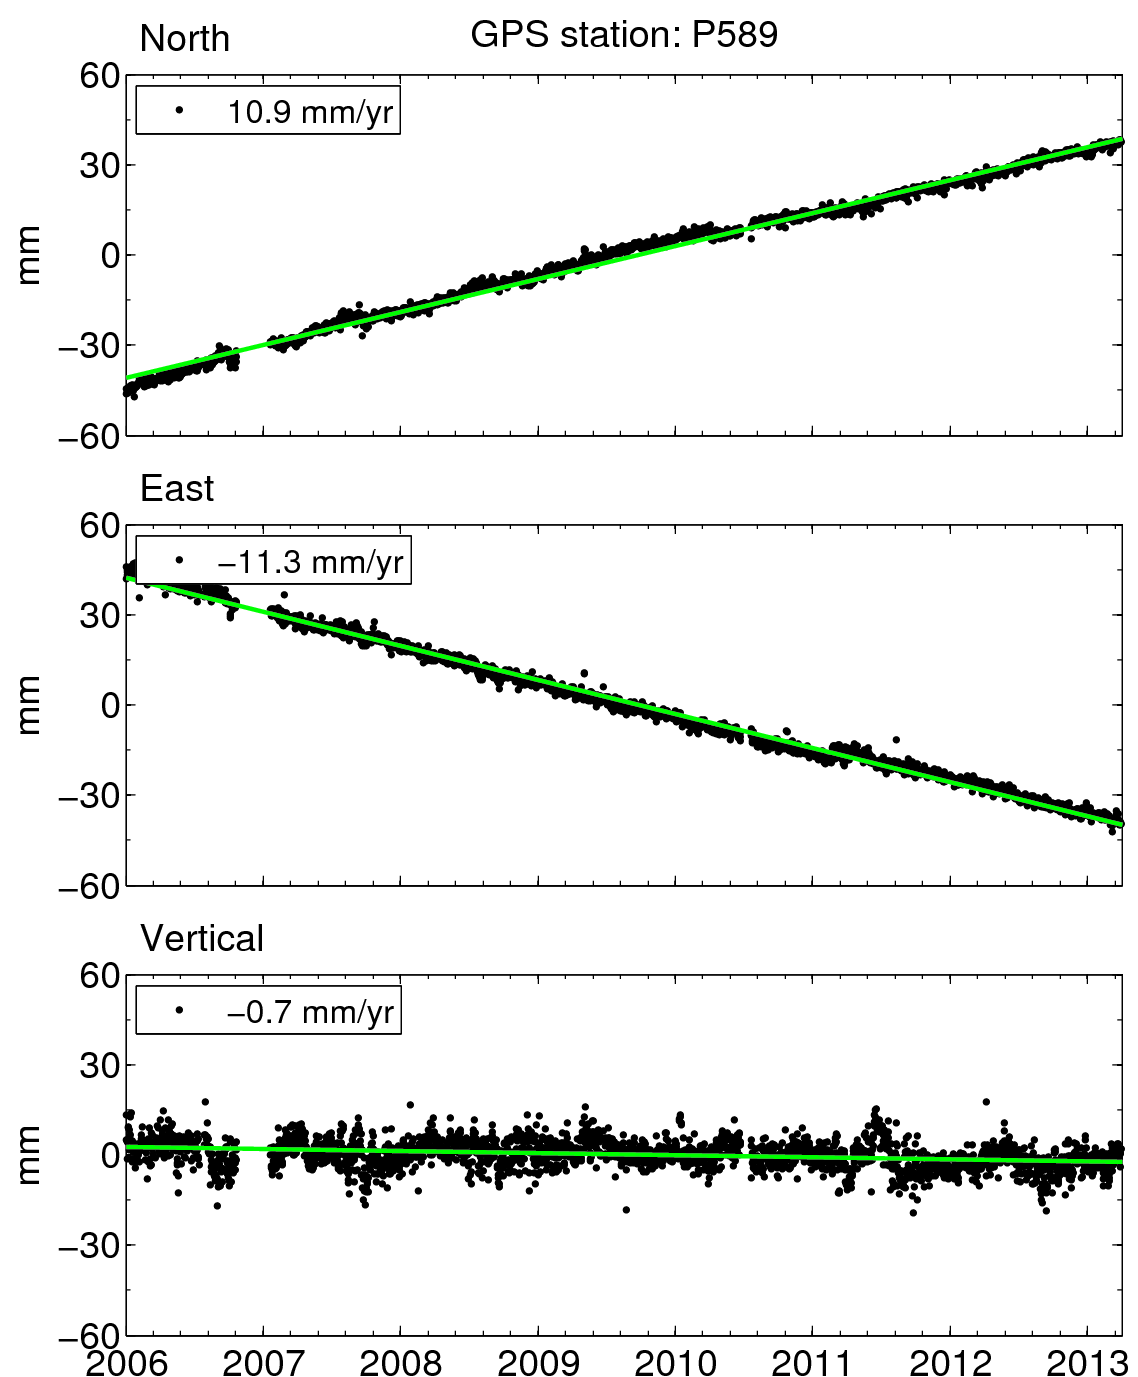