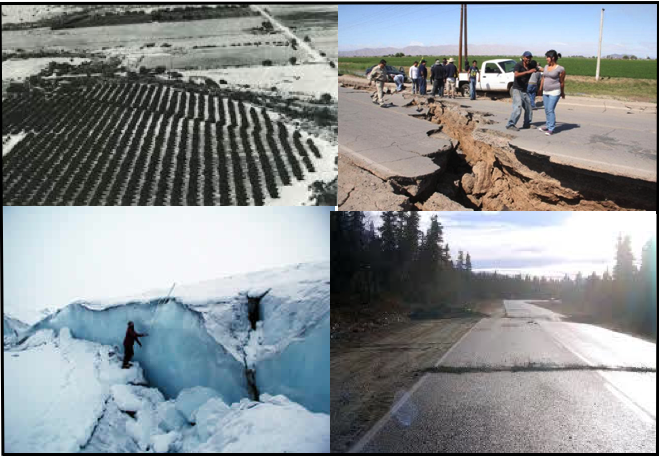
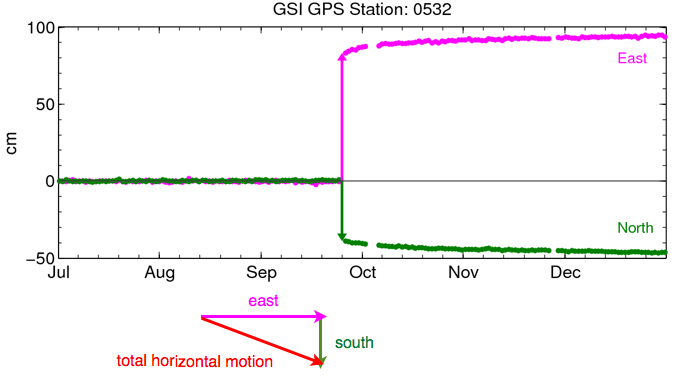
We are reminded of how strong earthquakes are when we see photographs showing Earth's crust torn apart or deformed (Figure 1). GPS is a powerful tool for studying earthquakes because it can very accurately tell scientists how much the ground moved during the earthquake. How does GPS do this? Geoscientists use the data collected by continuously-operating GPS networks. Figure 2 shows a GPS time series for a station in Japan collected before and after the great Tokachi-Oki earthquake (September 25, 2003). You can see that the ground moved approximately 80 cm to the east and 35 cm to the south. This is sometimes called the "co-seismic offset." GPS can also measure changes in the vertical component. During this earthquake, this station moved ~20 cm downwards.


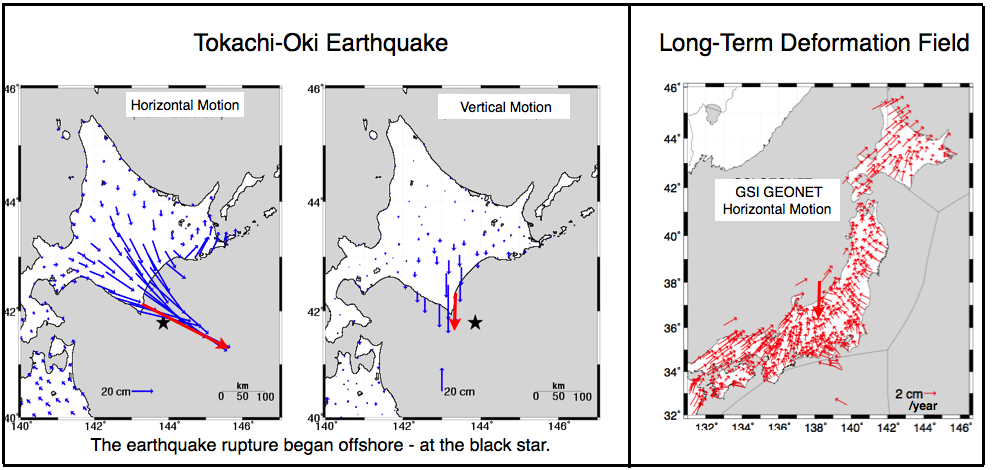
At the time of the Tokachi-Oki earthquake, the Japanese GPS network (operated by the Geographical Survey Institute) had more than 1000 instruments. The Tokachi-Oki earthquake was a thrust (compressional) earthquake, and so the GPS stations on Hokkaido moved to the southeast and downwards. The stations closest to the epicenter moved the greatest distances. The earthquake displacement vectors shown in Figure 3 are used by scientists to model the rupture. Shown to the right in Figure 3 are the "normal" displacements experienced in Japan due to plate tectonics. Credit: Kristine Larson

Historically, GPS scientists have used all the data from one day to calculate a single position. But if the GPS receiver is recording data every second, it is possible to calculate position every second. This means that a GPS receiver can act like a seismometer. Shown in Figures 4 and 5 are examples of GPS seismology from the great Maule earthquake in Chile and the M7.2 earthquake in Baja California, Mexico.
For a GPS receiver to provide useful information about seismic waves, the ground motions must be fairly large. This means GPS is best used for earthquakes bigger than magnitude 6. If the GPS data are made available in real-time (that is, almost immediately), these data can be used for earthquake and tsunami early-warning systems. The goal of these systems is to warn people before the seismic tsunami waves reach them.
Last modified: 2019-12-26 16:24:59 America/Denver


Please send comments and corrections to education unavco.org.
Copyright © 2012 - 2026 UNAVCO and the GPS Reflections Research Group.
All Rights Reserved.