Questions for Ken Hudnut
How did you become a scientist/engineer?
My grandmother earned her Ph.D. in biochemistry and had a laboratory where she ran experiments with lots of interesting equipment and lab animals. When I was a baby, I was actually bitten on the toe by one of the rats that my older brother had accidentally let escape from its cage. That may explain a lot, kind of like with Spider-Man, except I didn't get any superpowers as a result (that I know of yet). But I did become a scientist because I was really inspired by her career, and in fact, in college I also kept studying biology and even did research using lab rats. When I was young, however, my other grandmother called me Hawkeye and encouraged me about finding garnets for her among the mine tailings gravel on her driveway. Also, my mother took a field geology class with me at the local planetarium, so I became a pretty serious rock collector at about age 6. Then, in college, because of my great professors and the Mount Saint Helens eruption, I decided to go with Earth sciences instead of neurophysiology, and I never looked back. I did later switch from studying volcanoes to studying the San Andreas Fault and earthquakes, but that was just a practical matter of funding; I still am really interested in volcanoes, too.
What is your job like?
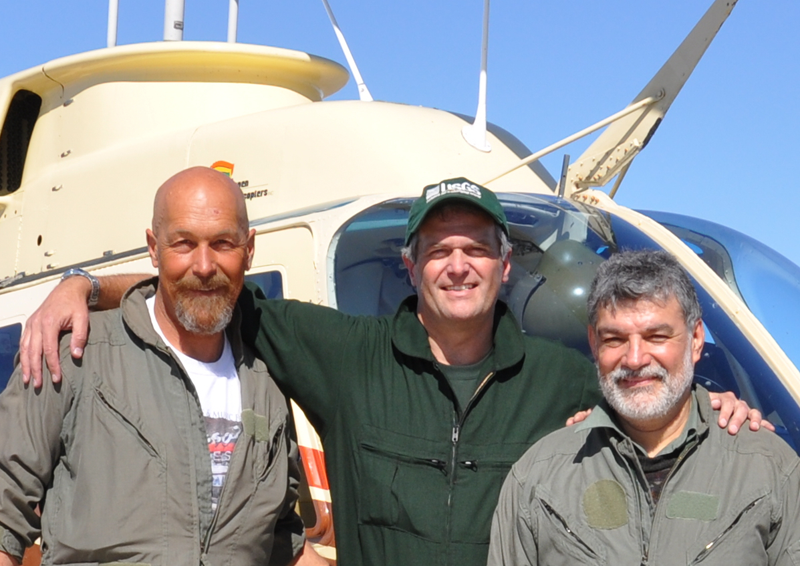
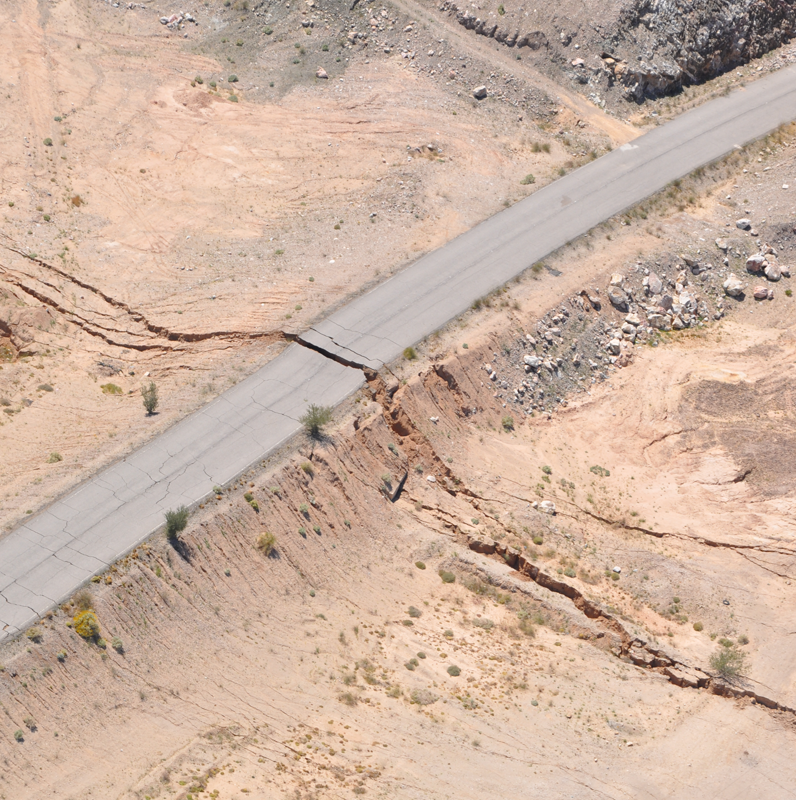
When a big earthquake happens, I get to venture out and do field work, which is what I love most of all about my job. Sometimes this means doing aerial reconnaissance of surface ruptures, and in Figure 1 that's what my colleagues and I had just done. The discovery of the array of fractures newly formed by such an event provides exciting memories that float back to mind sometimes when I'm sitting at my computer back at the office, waiting and preparing for the next Big One. I also enjoy the subsequent fieldwork to check and ground-truth my imagery interpretations and analysis.
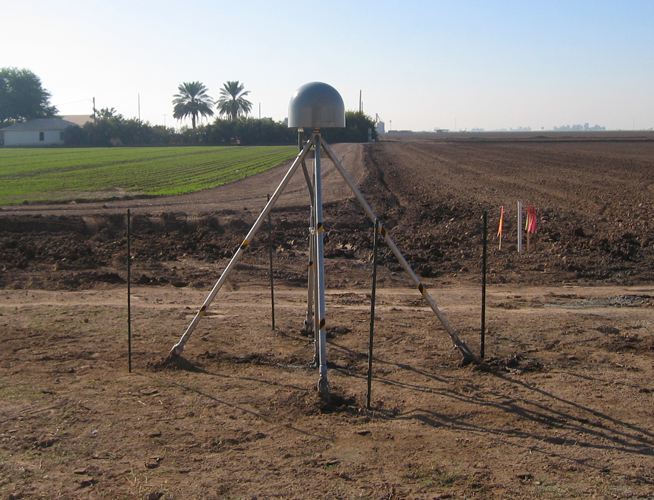
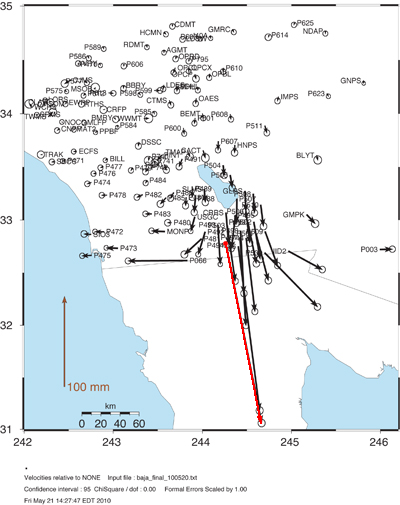
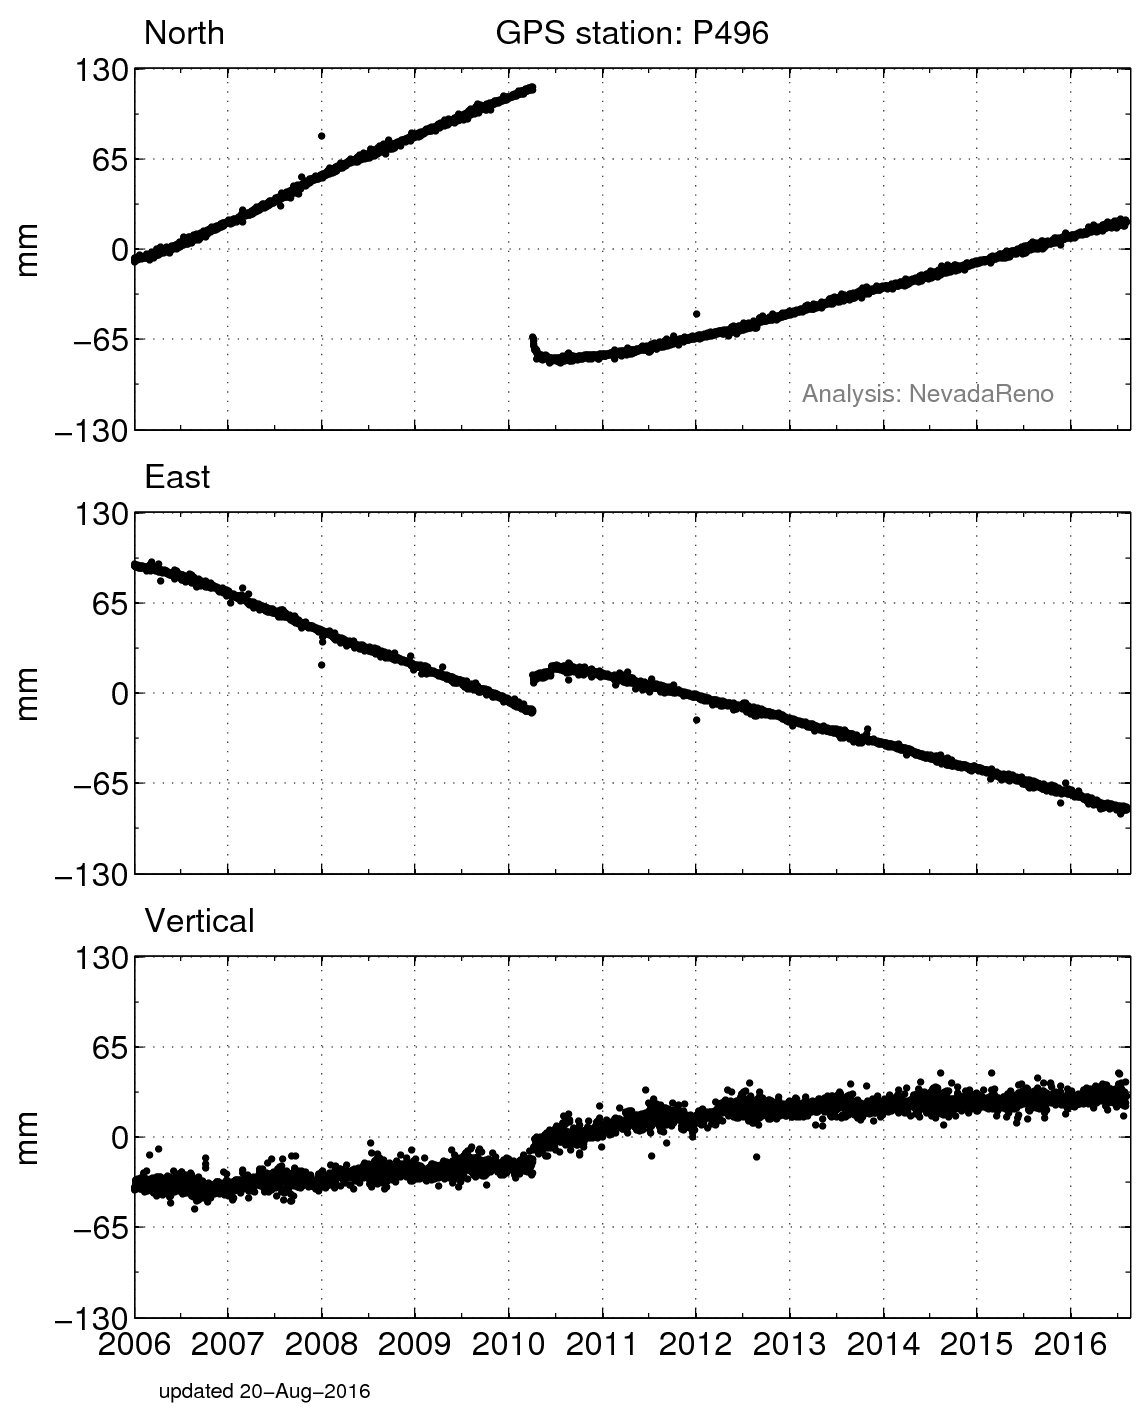
Most days, however, I sit at my computer in an office and study various GPS and imagery data sets to study earthquakes that happened a while ago. In some cases, these are recent, such as within the past few years or decade, but in other cases these may be ancient or prehistoric earthquakes that left a record in the landscape topography so that we can still study them today. In other cases, I study the ground deformation that is steadily loading faults up for future earthquakes, and try to see if there is anything other than uniform steady-state (constant, unwavering) deformation. With the Plate Boundary Observatory, we are all searching for non-steady motions, or what we call transient deformation, and whenever people find that it is very exciting because it is different than the expected rock-steady plate tectonic motion.
What are you hoping to learn from your research?
Lately, we have figured out how to bring real-time GPS results into the prototype Earthquake Early Warning system. The idea is to get enough information within seconds to provide an alert message before people start to feel the strong shaking from an earthquake. GPS helps strengthen the data needed for large, potentially damaging earthquakes, and it complements the seismic data that are also in use already. I'm also working on new ways to image the ground surface along active faults, and to do so repeatedly before and after earthquakes, and then to take the difference and use that to analyze how faults slip. This will tell us a lot about the physics of the earthquake source, which we need to know in order to better predict damage patterns that may occur in future earthquakes.
When people hear that I study earthquakes for my job, many times they ask me "when's the Big One?" Unfortunately, we are not even close to predicting the locations, sizes and timing of big, damaging earthquakes. So I just say, "Any day now" because we expect it could happen at any time. Being prepared means not only having an earthquake kit and plenty of extra water stored, but it means that as scientists we need to keep building networks of instruments with which to capture the important data that will be needed to break down and understand the complex natural system behavior, such as how slip on the fault generates the energy that travels across large distances and causes such extensive damage. By understanding through data, we have hopes of eventually being able to predict at least some aspects of earthquakes and fault system behavior. As scientists, it is our goal to understand and predict, and we are making good progress, for example, with our prototype earthquake early warning system.

 unavco.org.

 Spotlight Map
 GNSS Videos
 Funding and Acknowledgements