Observing and monitoring the growth of vegetation on Earth's surface (phenology) is important for many disciplines and applications. Vegetation growth is used in climate and hydrologic models, validation of satellite data, farming, and testing of eco-hydrological hypotheses. There are three variables that are important for understanding vegetative growth. The first is the onset (or time) of green-up (when the plant starts to turn green) and senescence (plant aging, typically when the plant starts to die or go dormant). Second, the time when maximum vegetation growth is reached, and finally the length of the growing season (Figure 1).
For many years scientists have been using an optical remote sensing system known as NDVI (Normalized Difference Vegetation Index) for this work. This system measures how green the Earth's surface is. Since plant greenness is correlated with chlorophyll production, it provides valuable information about plant health.
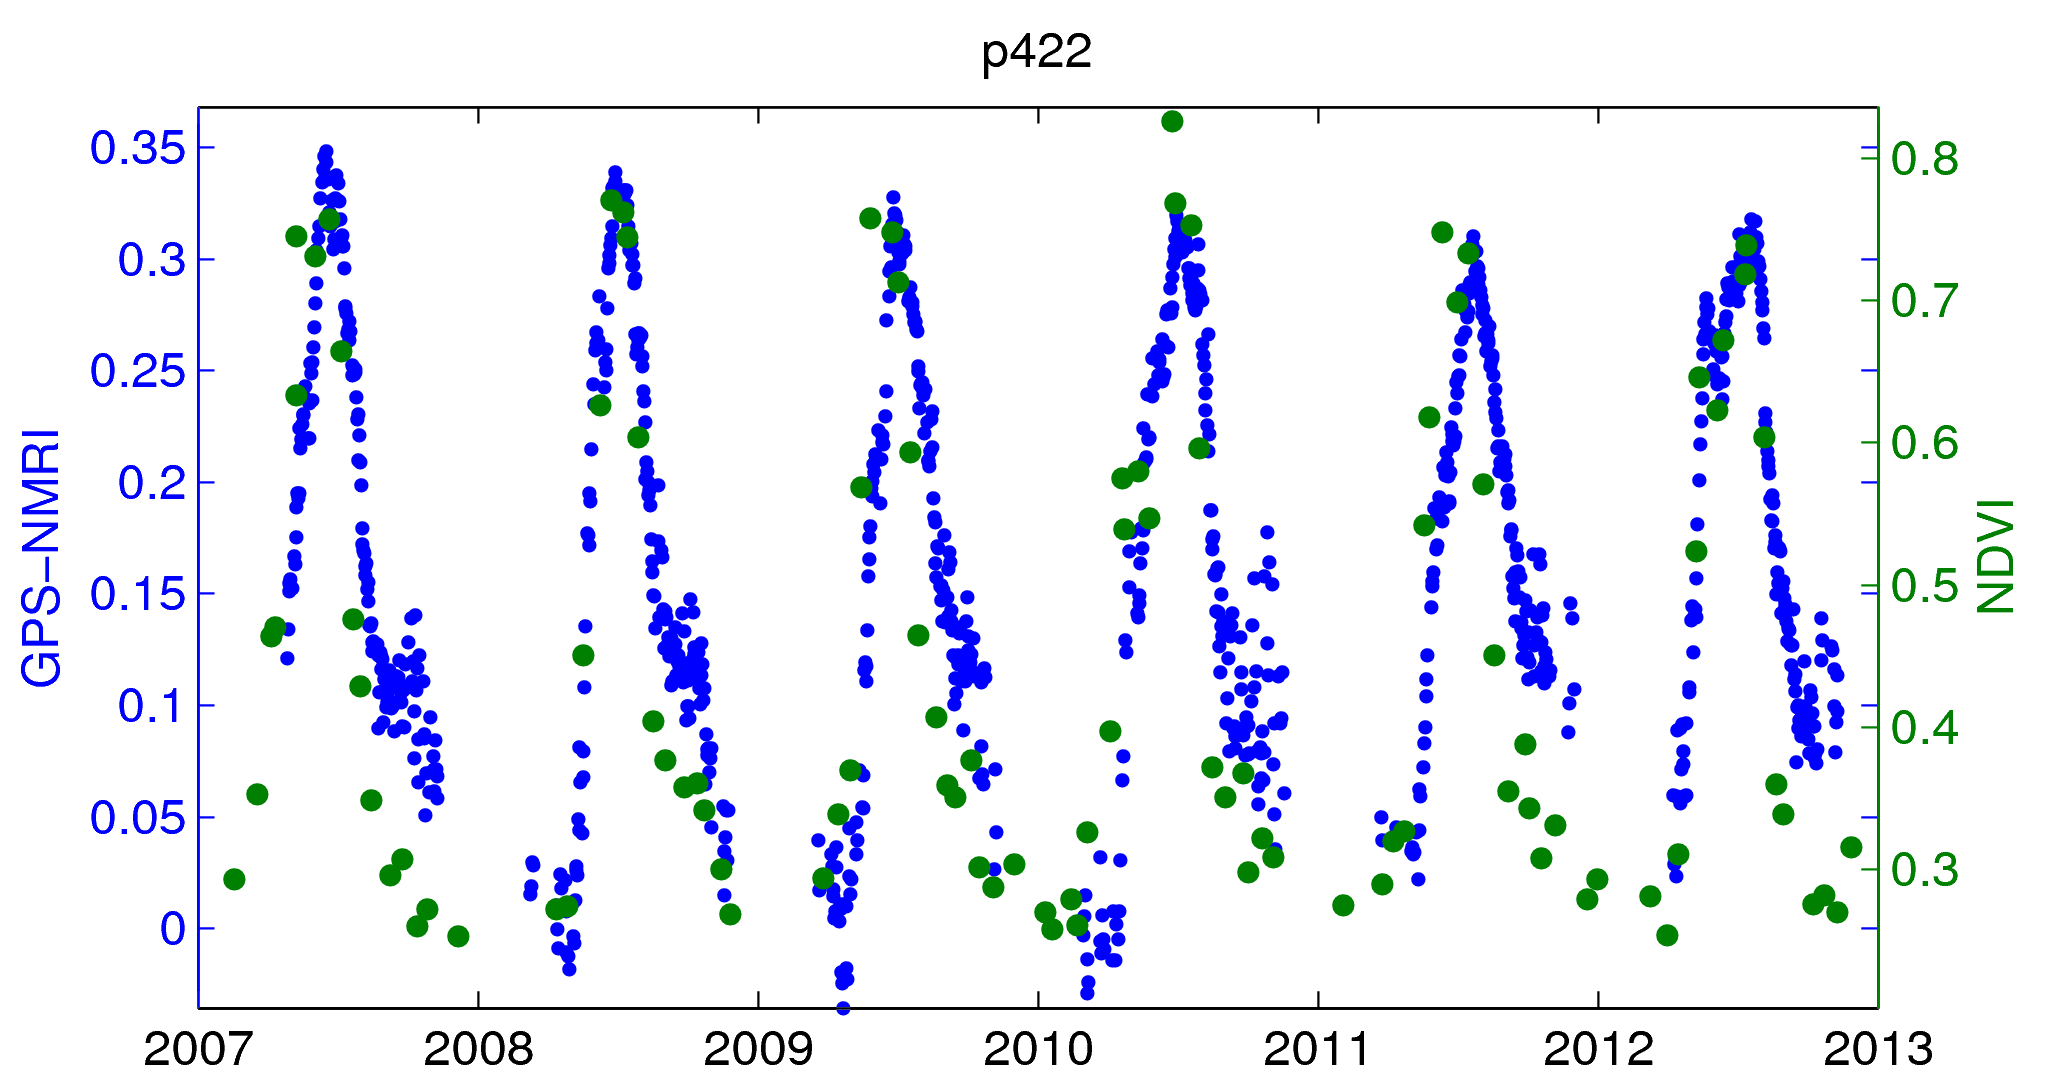
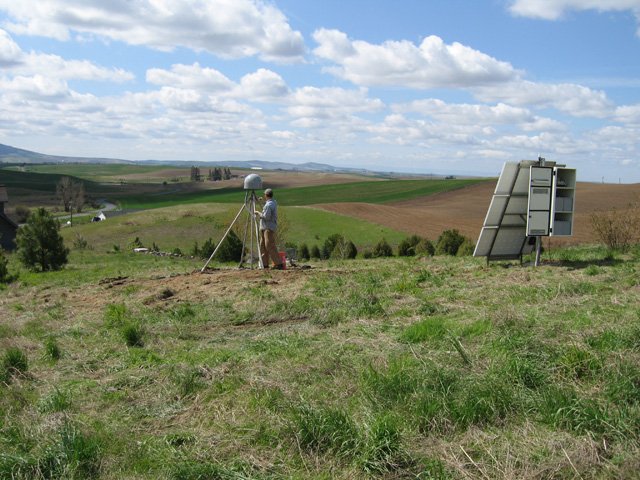
The PBO H2O group noticed that GPS reflections are also sensitive to phenology metrics. Shown below (Figure 2) are GPS-derived vegetation growth statistics, known as NMRI (Normalized Microwave Reflection Index), in blue and NDVI values in green for GPS site P422 (Figure 3). The correlation between the two time series is 0.8. To look at more vegetation data, see the PBO H2O data portal.


Last modified: 2019-12-26 16:24:59 America/Denver


Please send comments and corrections to education unavco.org.
Copyright © 2012 - 2026 UNAVCO and the GPS Reflections Research Group.
All Rights Reserved.