Most scientists use GPS to measure position. However, there is a growing community of GPS scientists that are using noise on the GPS signal to do their science. For these applications, reflected GPS signals (also known as multipath) are used.
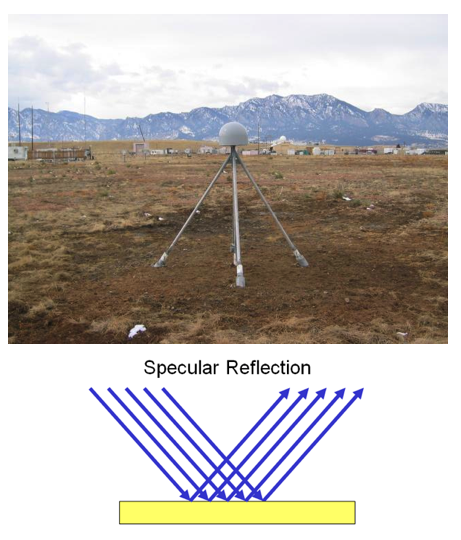
Reflected GPS signals were first proposed as a remote sensing tool by Martin-Neira in 1993. Most of these early studies of GPS reflections were developed for aircraft or space platforms. In those experiments, the receiver/antenna systems were optimized to receive the reflected signals. Research pioneered by the PBO H2O group takes advantage of reflections observed at geodetic-quality GPS sites (Figure 1). The antenna is inside the hemispherical acrylic dome. The antenna is typically about two meters above the ground. This particular GPS antenna was designed to suppress reflected signals (specular reflections). However, reflections can still be measured at many existing sites, allowing us to take advantage of thousands of GPS sites operating around the world.
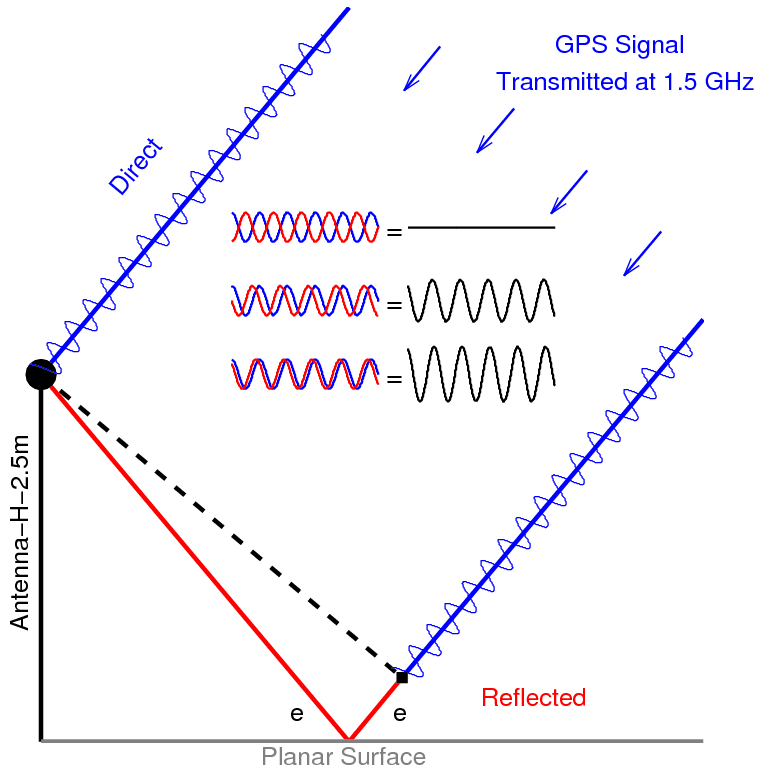
For most people that use GPS receivers, the observed quantity is the distance between the satellite and the antenna. However, depending on how smooth the surface is, a GPS receiver can also sense a reflected signal. The beating of the direct and reflected signals turns a GPS receiver into an interferometer (Figure 2). To a first order, the observed frequency depends on the height of the antenna above the reflector (H) and the GPS wavelengths (19 cm for L1 and 24.4 cm for L2). These effects can be seen in all data. We focus on the signal to noise ratio (SNR) data.


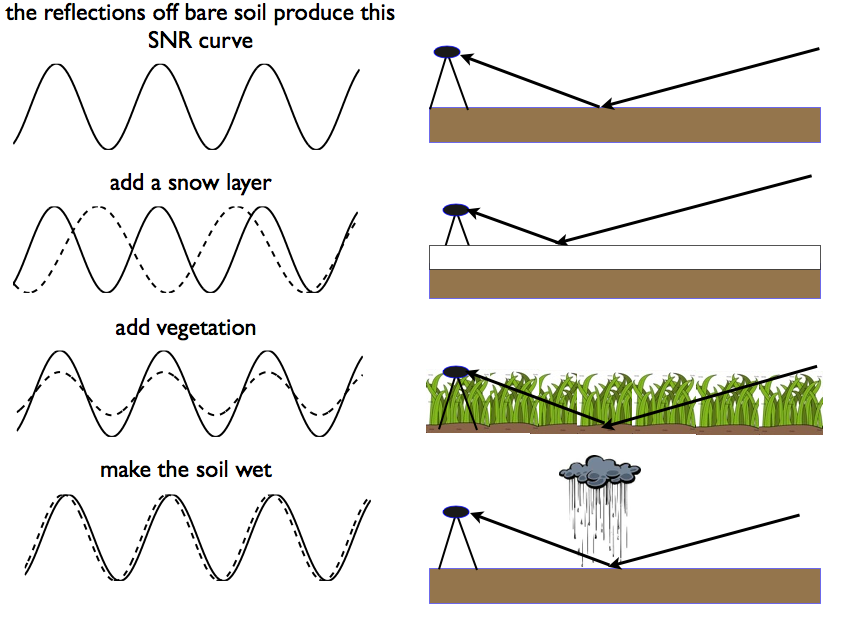
Below we summarize the kinds of way you can use the reflected signals in SNR data to study the water cycle. At top we start with the "bare soil" reflection. This sine wave has a certain frequency, phase, and amplitude. If instead of soil, the signal bounces off the snow layer, the frequency changes (dashed line). If the reflected surface has vegetation on it (particularly vegetation with water in it), the reflection is suppressed. So the frequency doesn't change much, but the amplitude can change a lot. Finally, the hardest signal to see is soil moisture changes when it rains. This causes a very small phase shift in the SNR data.

Last modified: 2019-12-26 16:24:59 America/Denver


Please send comments and corrections to education unavco.org.
Copyright © 2012 - 2026 UNAVCO and the GPS Reflections Research Group.
All Rights Reserved.