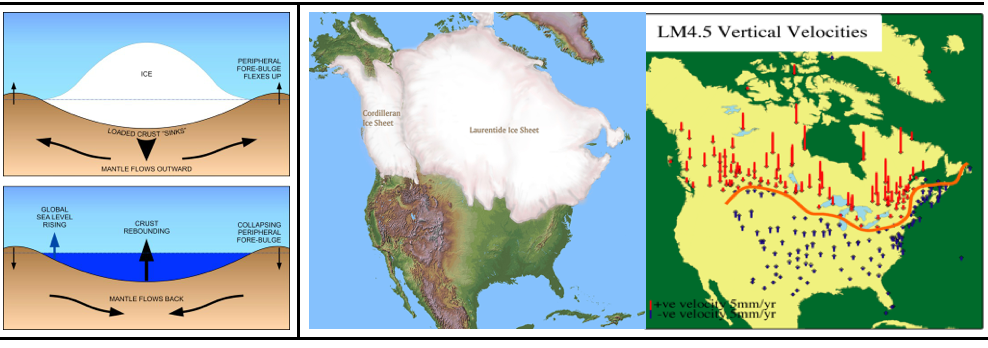
Glacial Isostatic Adjustment (GIA) refers to motions caused by large ice loads on Earth. Initially the weight of ice loads (such as the Laurentide Ice Sheet, Figure 1) causes the crust to move down; this forces mantle material to move laterally. When the ice has melted, the crust slowly "rebounds," with a return flow of mantle material.
The effects of GIA were observed in Sweden in the early 1700s, as people began to notice that the coastline had expanded and sea level had fallen. Anders Celsius, of temperature-scale fame, was commissioned to study the issue. To serve as a reference point, he had a sea level mark cut in a rock at Lofgrund Harbor in 1731. In a dozen years, sea level dropped more than 15 cm below the mark. Celsius hypothesized in a 1743 report that sea level was dropping and that the change was caused by evaporation, but his theory was proved wrong. Over time, additional sea level marks were cut into rocks along the Swedish coastline. A consistent rate of change at all sites would be evidence supporting a drop in sea level. By the early 1800s, data from multiple sites showed that the rate of change was different at different sites, which supported an alternative theory: the land was being uplifted.
In addition to Scandinavia, GIA is also very apparent in Canada (Figure 1). We can now use GPS to measure the uplift (and depression) caused by GIA. Why do scientists care? These data - if measured over a broad region - help constrain the correct value for the viscosity of the Earth's mantle. The model shown in the right side of Figure 1 is calculated for a particular viscosity value. By comparing the GPS observations with different viscosity models, scientists can find the viscosity value that best fits the GPS data.

Last modified: 2019-12-26 16:24:59 America/Denver


Please send comments and corrections to education unavco.org.
Copyright © 2012 - 2026 UNAVCO and the GPS Reflections Research Group.
All Rights Reserved.