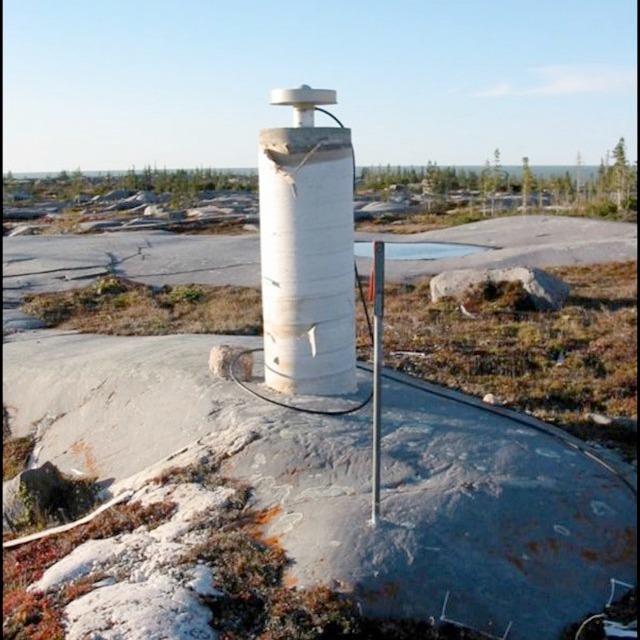
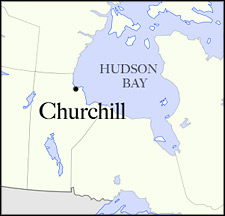
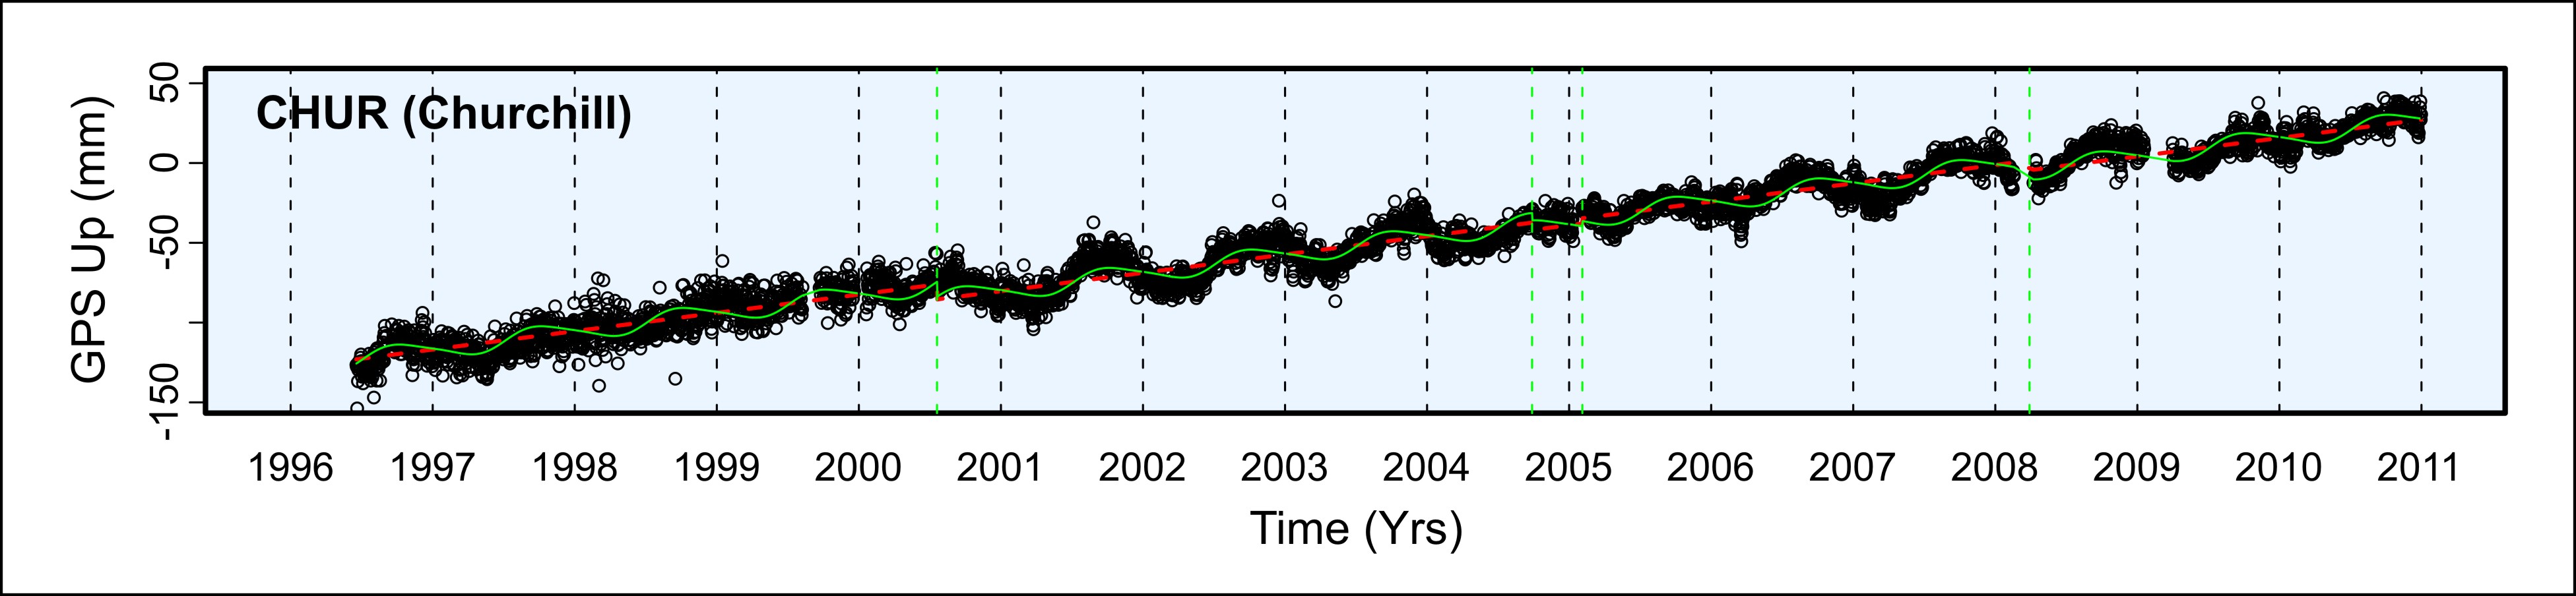
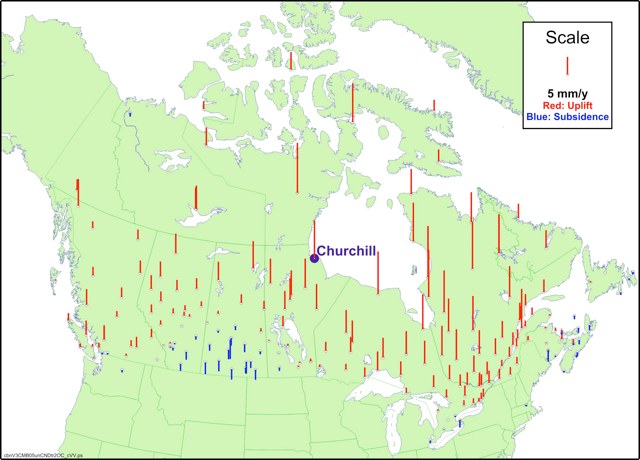
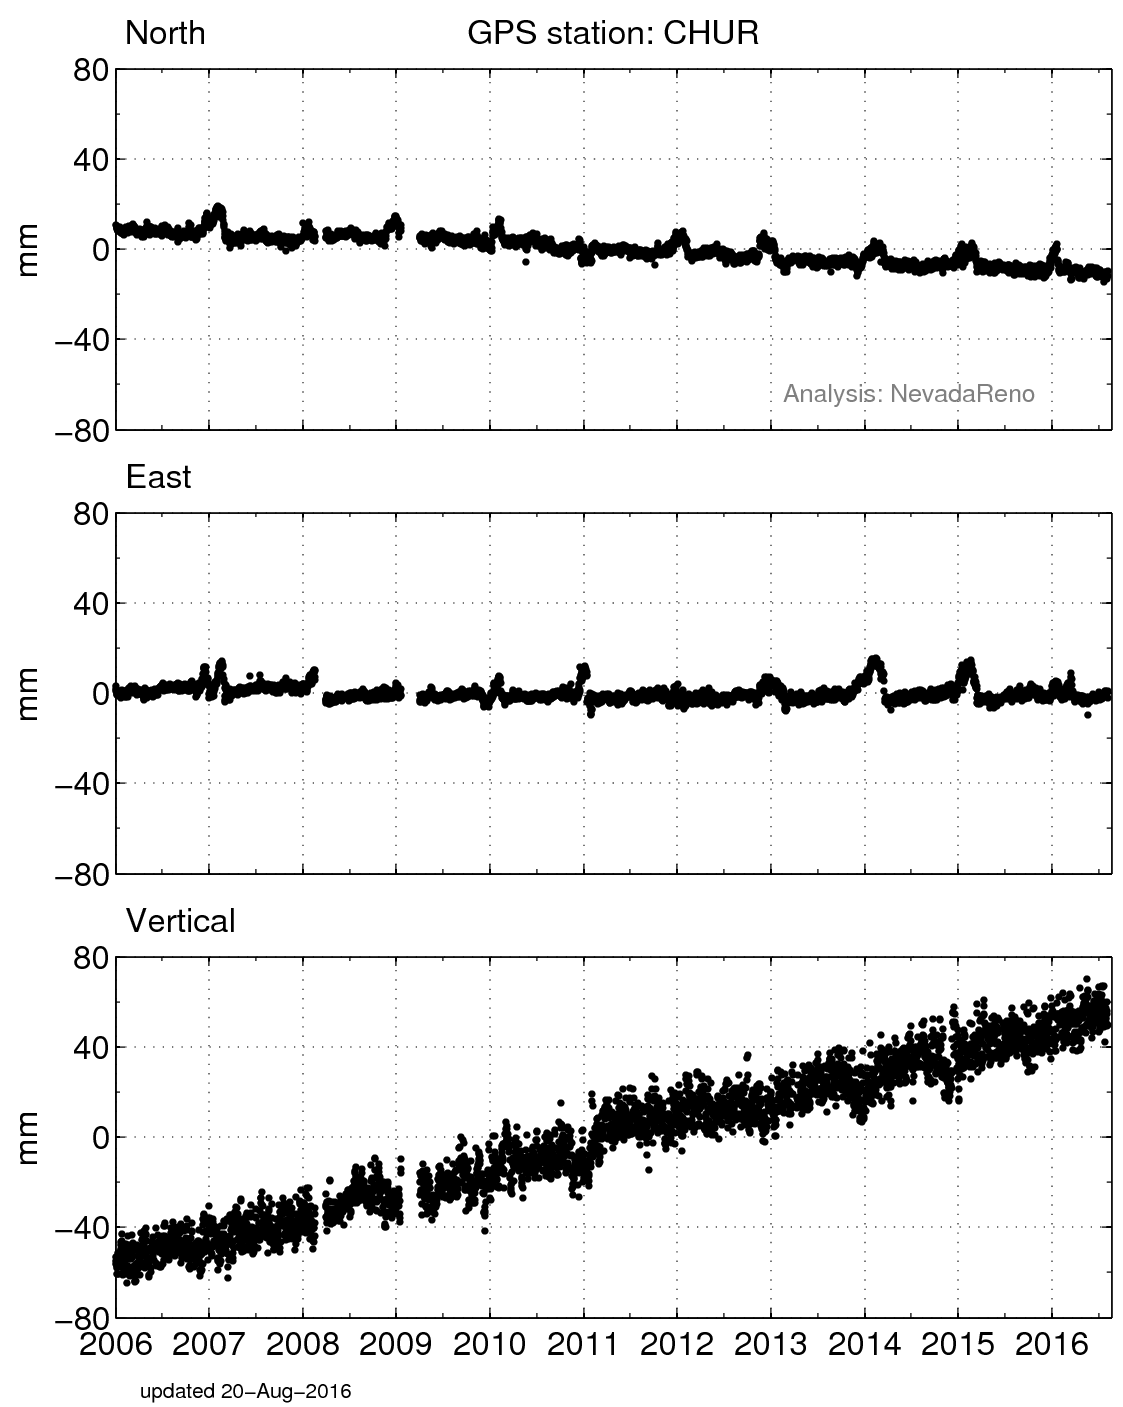
Science Spotlight

Station CHUR


Researcher: Joe Henton
Geodetic Survey Division
Natural Resources Canada


GPS station CHUR is rising 1 cm/yr due to Glacial Isostatic Adjustment.


Name: Churchill
State: Manitoba
Country: Canada
Elevation: -19.5 m
Lat/Long:  58.7591 / -94.0887

Glacial Isostatic Adjustment

Most of Canada was once extensively covered by the Laurentide Ice Sheet and its huge weight deformed the Earth's surface. During the last peak of glaciation about 20,000 years ago the ice was nearly three kilometers thick in some areas. The mass of the ice caused downward warping of the crust and forced viscous material in the underlying mantle to flow away from ice-covered regions. This effect raised land peripheral to the glaciers. As the glaciers retreated, the process reversed and the land that had been underneath the ice began to rebound. Reaching equilibrium may take 10,000 years or more. This process is called Glacial Isostatic Adjustment (GIA).

GPS data allows us to measure precisely the pattern and rates of vertical deformation here and in other regions experiencing GIA. The overall pattern of uplift and subsidence across Canada can be seen in Figure 2, with a detailed graph of the vertical position change at Churchill in Figure 3.

Figure 1. Generalized process of glacial isostatic adjustment. The top panel illustrates the effects when the Earth's surface is loaded by a heavy ice sheet. The lower panel shows the rebound effects once the ice sheet is removed. Figure courtesy of the Canadian Geodetic Survey, Natural Resources Canada


Figure 3. The rate of uplift (red dashed line) at Churchill is approximately 1 cm/yr. This site also exhibits seasonal variation (green solid line). Discontinuities in the GPS time series occurred when equipment was changed (vertical green dashed lines). Figure courtesy of the Canadian Geodetic Survey, Natural Resources Canada


Figure 2. Map of vertical GPS uplift velocities across Canada. The observed pattern of uplift across Canada is consistent with glacial isostatic adjustment. Figure courtesy of the Canadian Geodetic Survey, Natural Resources Canada.


Figure 4. Position changes for CHUR in a North American fixed reference frame. (For help interpreting the graphs, see the GPS Data page.)

Spotlight Questions

  • Every December, CHUR's position "speeds up" and then slows back down after January. You also see a fair number of data gaps during this period. Do you think this is the Earth, or might it be a problem with the instrument? Any ideas about what could cause this signal?
  • How does the rate of uplift at Churchill compare to other sites in Canada?

Last modified: 2019-12-26  16:24:57  America/Denver  


Please send comments and corrections to educationunavco.org.

Copyright © 2012 - 2024 UNAVCO and the GPS Reflections Research Group.
All Rights Reserved.

Funding and Acknowledgements.