Questions for Jeff Freymueller
How did you become a scientist/engineer?
I was always interested in science, for as long as I can remember, although when I was young I didn't think about it as science. I just always wanted to know how everything worked, what made things happen the way they did, and questions like that. So at various times, I was totally interested in chemistry, geography, stars, why some places were deserts, all sorts of random things. I think I became a scientist because I never stopped asking questions about everything, never stopped being curious and wanting to figure things out.
The more specific path to my current job as a scientist was definitely a result of following a path of exploration rather than having a master plan. I got very sick one term in college, and although I did graduate in four years from a very challenging school, my academic record was not stellar (mostly) because of the time I lost to that. I went to graduate school because I didn't have any better plan than to continue learning about things that seemed interesting, and I picked potential graduate schools based on places I thought I would like to live. Once I got there, I met a professor who had a project that sounded interesting, using a new tool called the Global Positioning System to measure plate tectonics. The idea caught my interest enough that I followed my advisor across the country when he got a new job. Within a couple of years of working on the project, I found that I could not imagine doing anything else. It has been that way ever since, although of course my specific research topics have changed and grown over the years.
What is your job like?
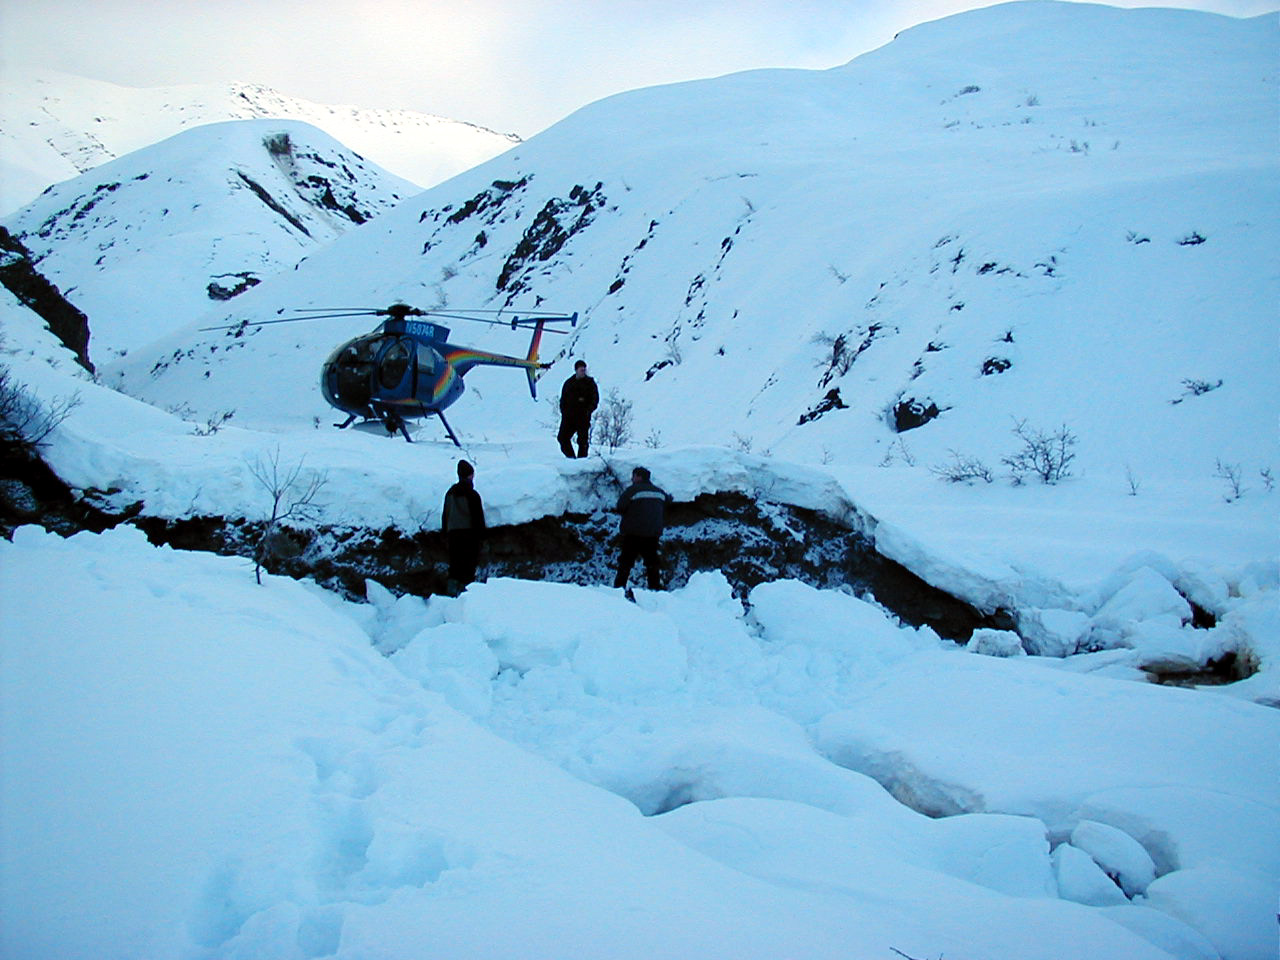
My job has me traveling all over, including all over the world. When I was younger, I got to do a lot of fieldwork. I still love doing that, but now I have a lot of other responsibilities so most of the time I get to send my students out to the field. I make sure to get out for a couple of trips to the field every summer, at least. I have worked in China and with colleagues in China for 17 years now, and that has meant a lot of trips to China to work with colleagues there. As I have friends and colleagues literally on every continent, I have had a chance to interact with people from all over the world. Most of my time, though, is spent on ordinary tasks—teaching, sitting at the computer and writing, or writing computer code, or looking at data. I make sure to spend some time every week looking at new data just to see what it shows. It never stops being exciting to see some new information and think about how it fits into my mental picture of how everything works.
What are you hoping to learn from your research?
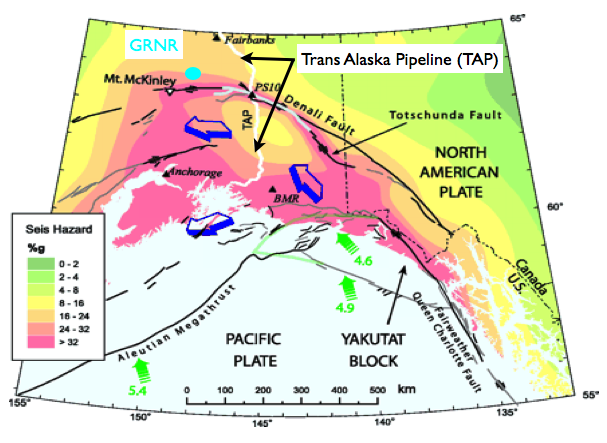
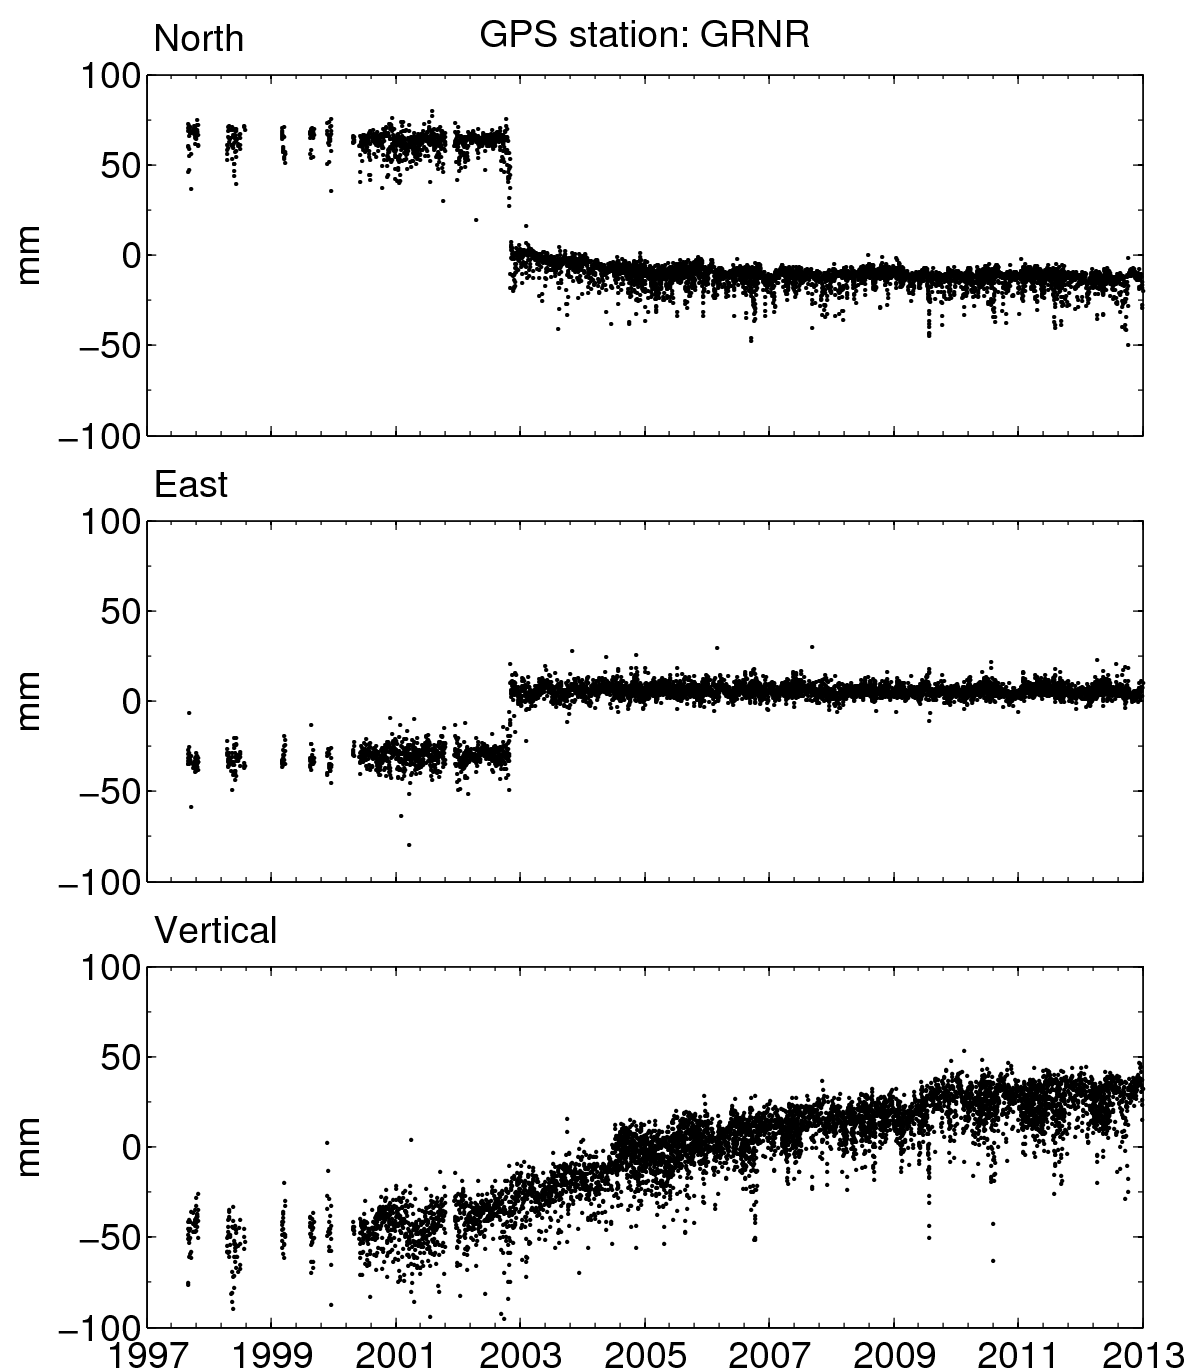
I am interested in everything that makes the Earth's crust move and deform. Although the motions are slow, there are a lot of active processes that do that: plate tectonics, earthquakes, volcanism, the past and present loss of ice from glaciers, icefields, and ice sheets, and even the movement of surface water around the planet. I want to learn how these processes interact, and how each one shows us what the physical properties of the Earth are. The GRNR site was the second continuous GPS site we set up in Alaska, but actually the first one I chose and really worked on myself. It was set up originally to look at the motion of the Denali fault, which is located about 25 miles to the south.

 unavco.org.

 Spotlight Map
 GNSS Videos
 Funding and Acknowledgements