Science Spotlight

Station P698


Researcher: Mike Lisowski
Cascades Volcano Observatory
U.S.G.S.

I work with interesting people on interesting problems related to mitigating geologic hazards.


GPS site P698, on the southeastern flank of Mount St. Helens. The mountain in the background is Mount Adams, another of the Cascade volcanoes.


Name: MSH SESLPE
State: WA
Country: United States
Elevation: 1479.4 m
Lat/Long:  46.1735 / -122.1606

Mount St. Helens Volcano

On May 18, 1980, Mount St. Helens erupted cataclysmically, sending ash all the way to New York and beyond. For the next six years, a lava dome formed in the volcano's crater, and then the volcano fell relatively quiet.

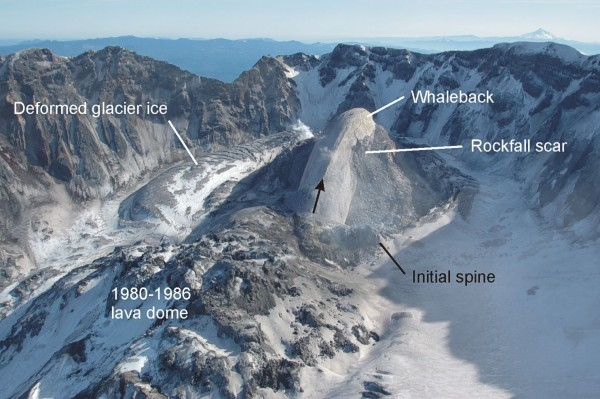
In October 2004, nearly 18 years later, Mount St. Helens began to again spew out ash and steam, and a lava dome again grew in its crater (Figure 1).

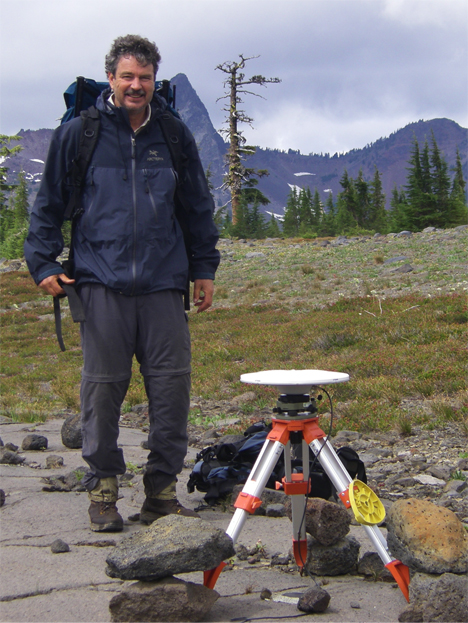
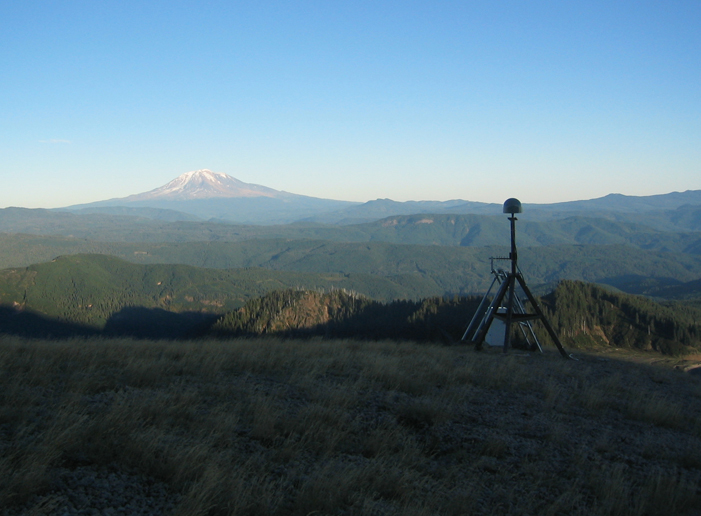
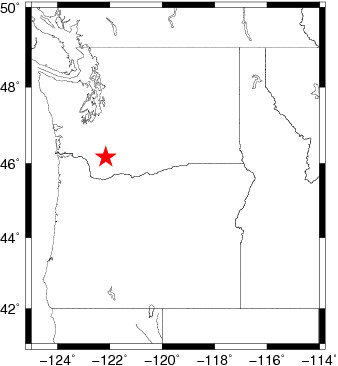
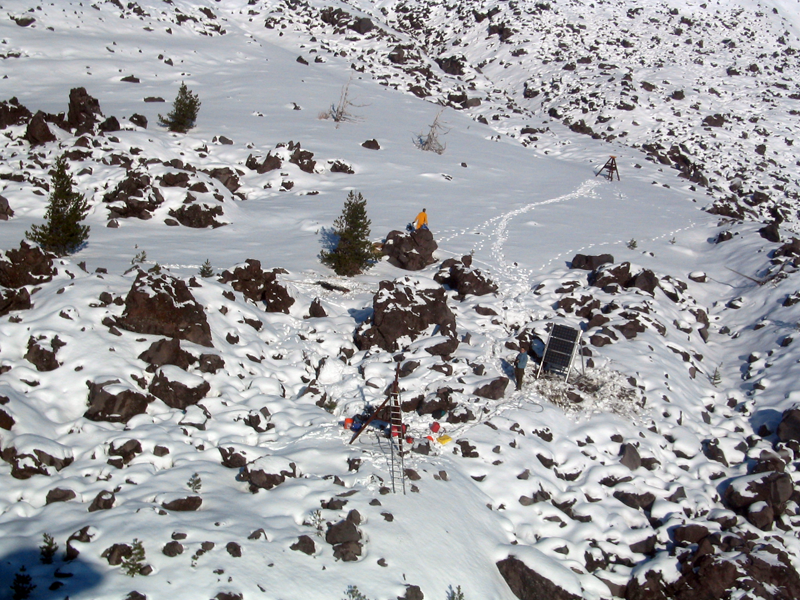
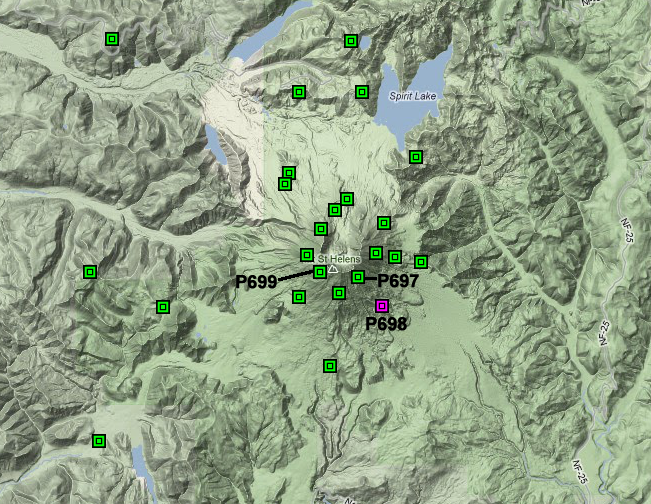
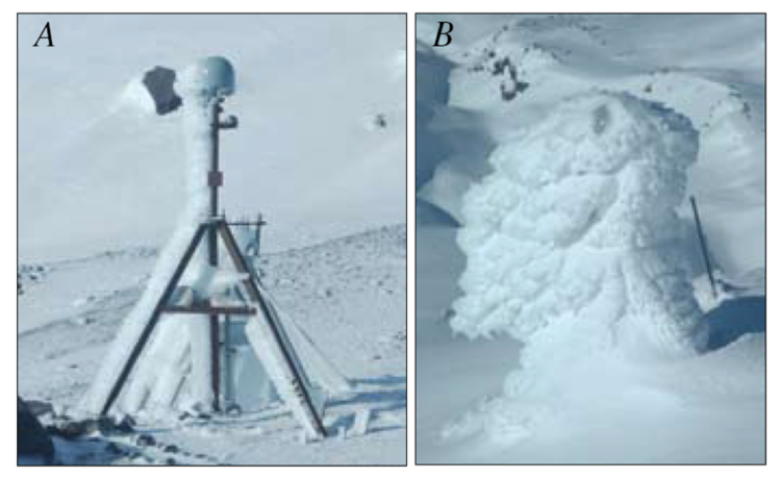
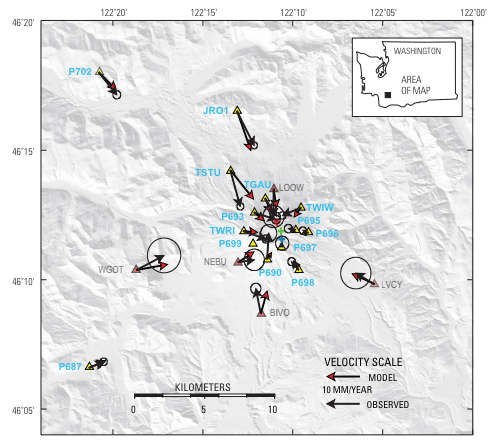
Station P698 is perched at 1480 m elevation on the southeast side of Mount St. Helens, about 3.5 km from the volcano's crater. The station was installed on November 4, 2004, about one month after the start of the volcano's 2004-08 dome-building eruption. The station is one of 21 continuous GPS stations installed around Mount St. Helens (Figure 2). Field engineers and scientists installed many of these stations, including P698, on mounts for an older monitoring system, and up high to avoid the mountain's heavy snow accumulation (Figures 3 and 4).

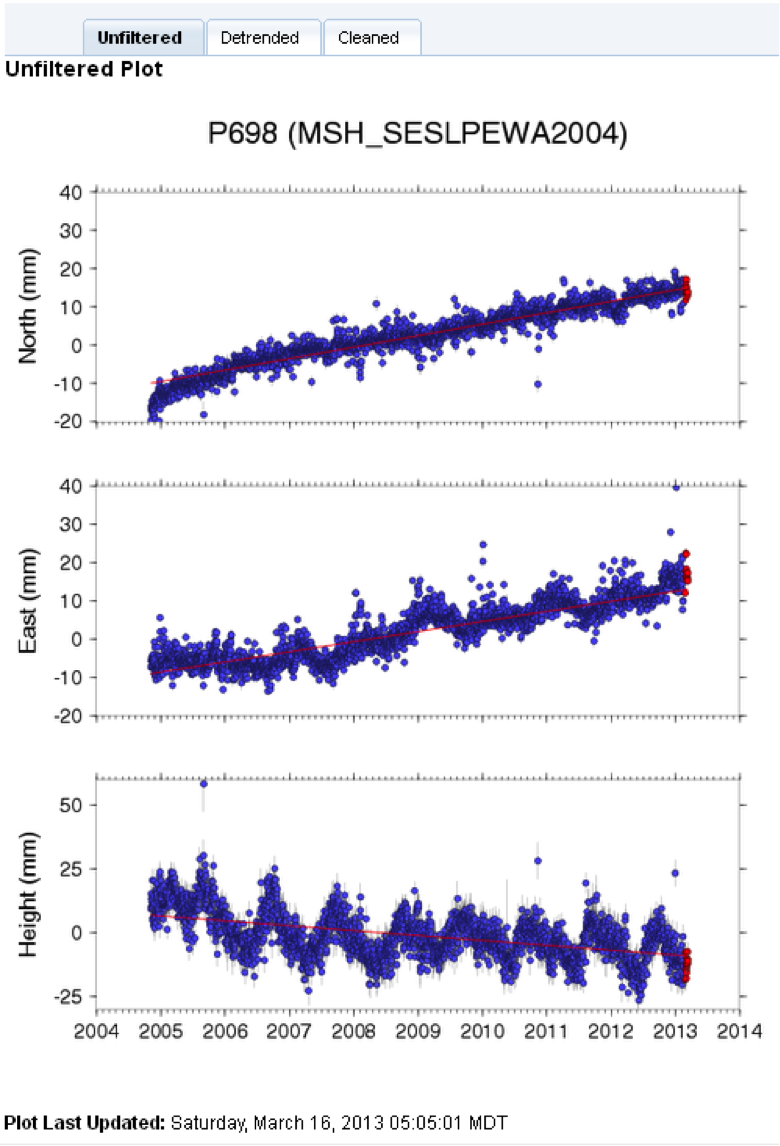
What we most want to see from P698's data is how the volcano is moving. But motions at the station come from several sources, and we have to detangle them before we can see what the volcano is doing. Looking at the time series in different ways helps us to differentiate these different motions, and other factors affecting the GPS signal.

We start with the "raw," or unaltered, time series, in Figure 5. We can see that the red line shows a linear fit to all the data. This nearly steady movement of the station since 2010 is typical of background tectonic—not volcanic—motion. (For more on this motion, check out site P405.) We can remove this signal to see how the volcano's motion is changing over time, which we do for Figure 6.

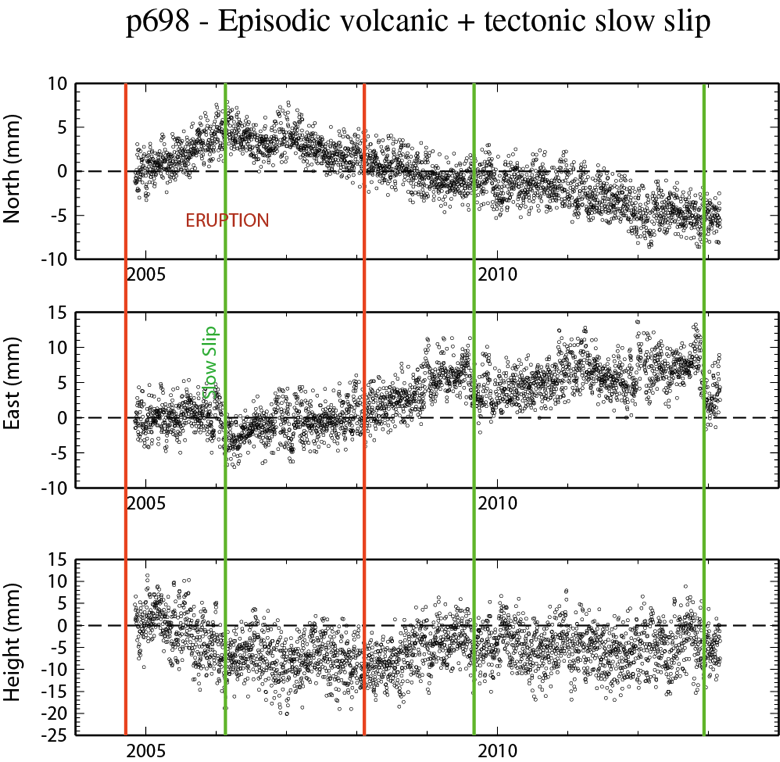
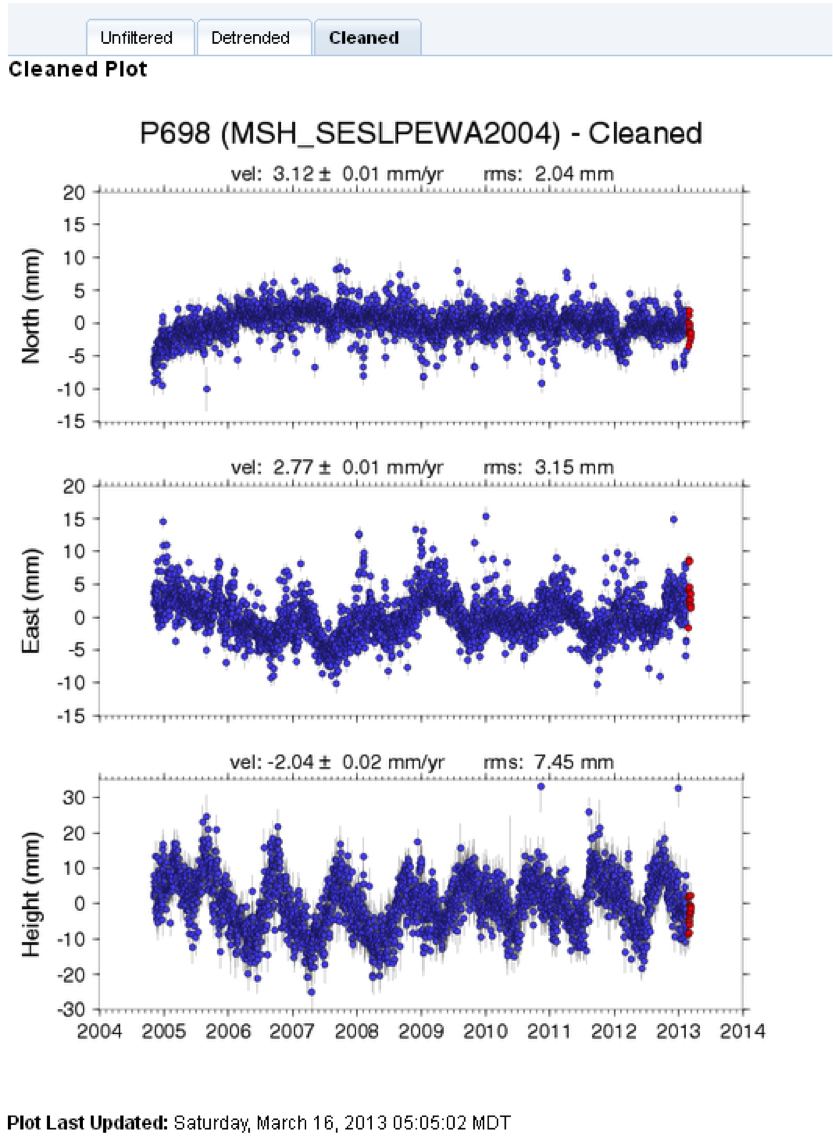
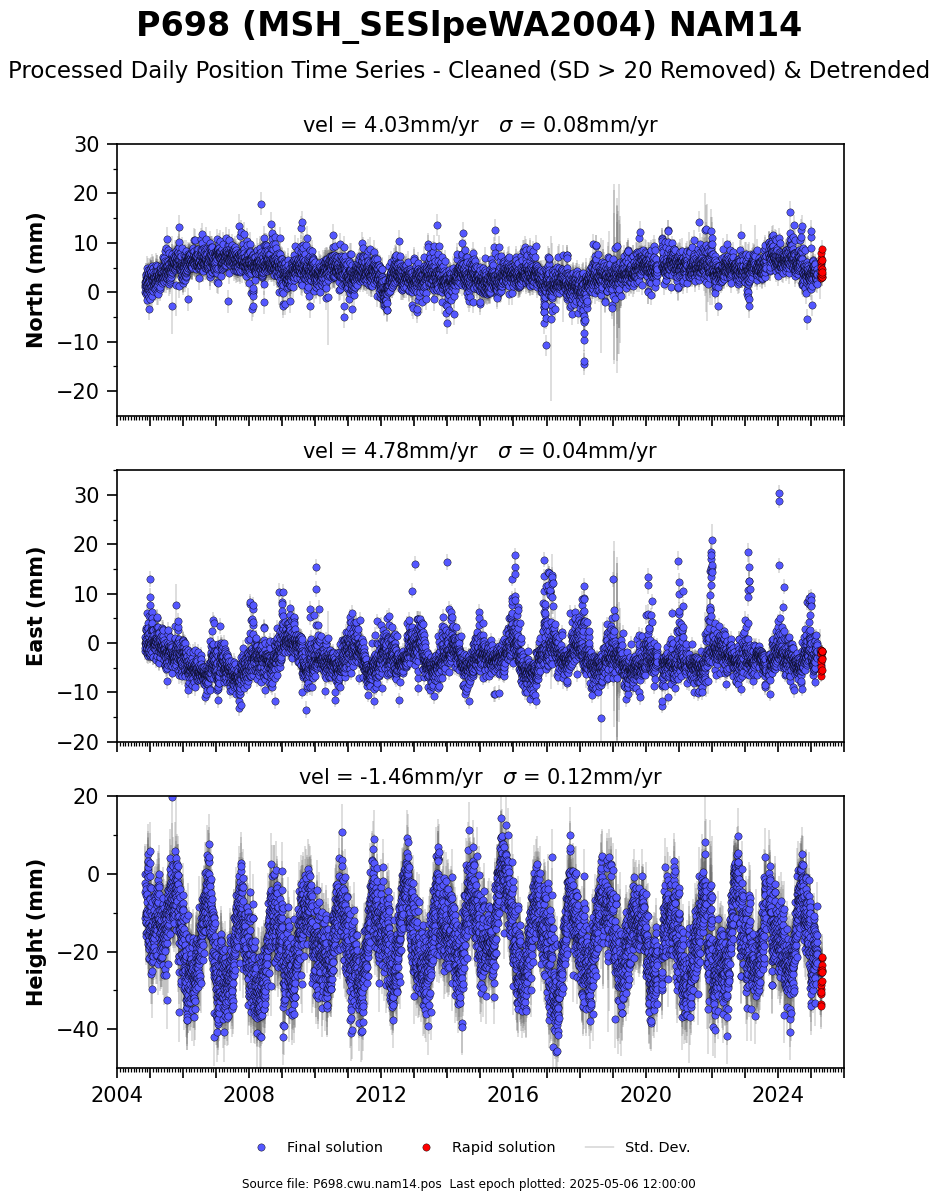
Next, there is a seasonal pattern in the data that we can get rid of. Seasonal patterns often reflect changes in the water cycle, like snowfall. In Figure 7, we remove these seasonal variations and we can clearly see the volcanic motion. For a year or two after being installed, the station moved faster to the north, west, and down than it did on average. This motion is directed toward the center of Mount St. Helens and is consistent with a slow inward collapse from the withdrawal of magma from deep in the crust to feed the 2004-2008 eruption. There is also a smaller, short-term reversal (outward and upward motion) after the eruption ceased in early 2008.

One more complication: the volcanic motion is mixed with primarily westward jerks, showing still another style of deformation. These westward movements occur during the slow slip events in early 2006, late 2009, and late 2012 (see ALBH for more about slow slip events). Like the long-term motion in Figure 5, these "jerks" result from subduction, not from the volcano.

Figure 1. Mount St. Helens' dome after it became active again in 2004. After the cataclysmic eruption of 1980, a lava dome grew in the volcano's crater until 1986. After 18 years, the dome began to grow again—in weird forms, like the "whaleback" shown above. (From USGS)


Figure 3. Station P698 from above. The GPS antenna is welded on top of an existing 3-meter tall steel tower, one of many installed after the cataclysmic eruption of May 18, 1980. The towers were originally used to mount reflectors used for different instrumentation that required scientists to make measurements from the field. The GPS data are sent to master computers through radio links so that scientists can monitor volcano deformation continuously and receive data even when the volcano is dangerous.


Figure 5. Position changes for P698 in a North American reference frame. Click here to see an updated uncorrected time series through the PBO website. (For help interpreting the graphs, see the GPS Data page.)


Figure 7. A more complete analysis of the data uses a model to predict the background tectonic motion and estimates and removes annual and semiannual components of seasonal noise. The trends in episodic tectonic deformation (called slow-slip events—check out site ALBH) and time-varying volcanic deformation are easier to identify in this plot.


Figure 2. Locations of GPS sites around Mount St. Helens, with P698 shown in pink. What direction would you expect P698 to move when the volcano is building to an eruption? What about during an eruption? (Map from Google Maps and the UNAVCO Data Archive Interface)


Figure 4. Winter comes early to Mount St. Helens and snow typically blankets its slopes through mid-June. Fortunately, station P698 is low enough where icing of the antenna is usually not much of a problem. Other stations higher on the mountain are sometimes coated or obscured with rime or buried under snow. (A) Minor icing at PBO station P697. P697 is on the southeast flank of the volcano, directly upslope from and 735 feet higher than P698. The ice affects the GPS signal, making it look like the station is moving when it is not. (B) An extreme case of icing at PBO station P699, to the west of the crater. The radome, the dome protecting the antenna, is barely poking out of the ice. (From USGS Mount St. Helens Professional Paper 1750, Chapter 15)


Figure 6. Position changes for P698 cleaned (with the ongoing tectonic motion removed). Click here to see an updated cleaned time series through the PBO website.


Figure 8. Data from all the deformation monitoring stations is combined to create a source model that can reproduce the deformation we observe. The map shows velocity vectors for Oct. 2004 to Oct 2005 in black. The velocity vectors for the model are shown in red. The center of the modeled underground source is shown as a red cross. The better the arrows match, the better the fit of the model. (From USGS Mount St. Helens Professional Paper 1750, Chapter 15)

Spotlight Questions

  • What are the different processes affecting the P698 data? What three different types of motion do you see? What is the source of the seasonal pattern not caused by motion of the GPS site?
  • Of Figures 5, 6, and 7, which do you think best shows the volcanic motion? Why?
  • What direction was P698 moving at the start of the 2004-2008 eruption? Is this what you would expect, based on the location of P698 relative to the volcano's crater? Why or why not?

Last modified: 2019-12-26  16:24:51  America/Denver  


Please send comments and corrections to educationunavco.org.

Copyright © 2012 - 2024 UNAVCO and the GPS Reflections Research Group.
All Rights Reserved.

Funding and Acknowledgements.
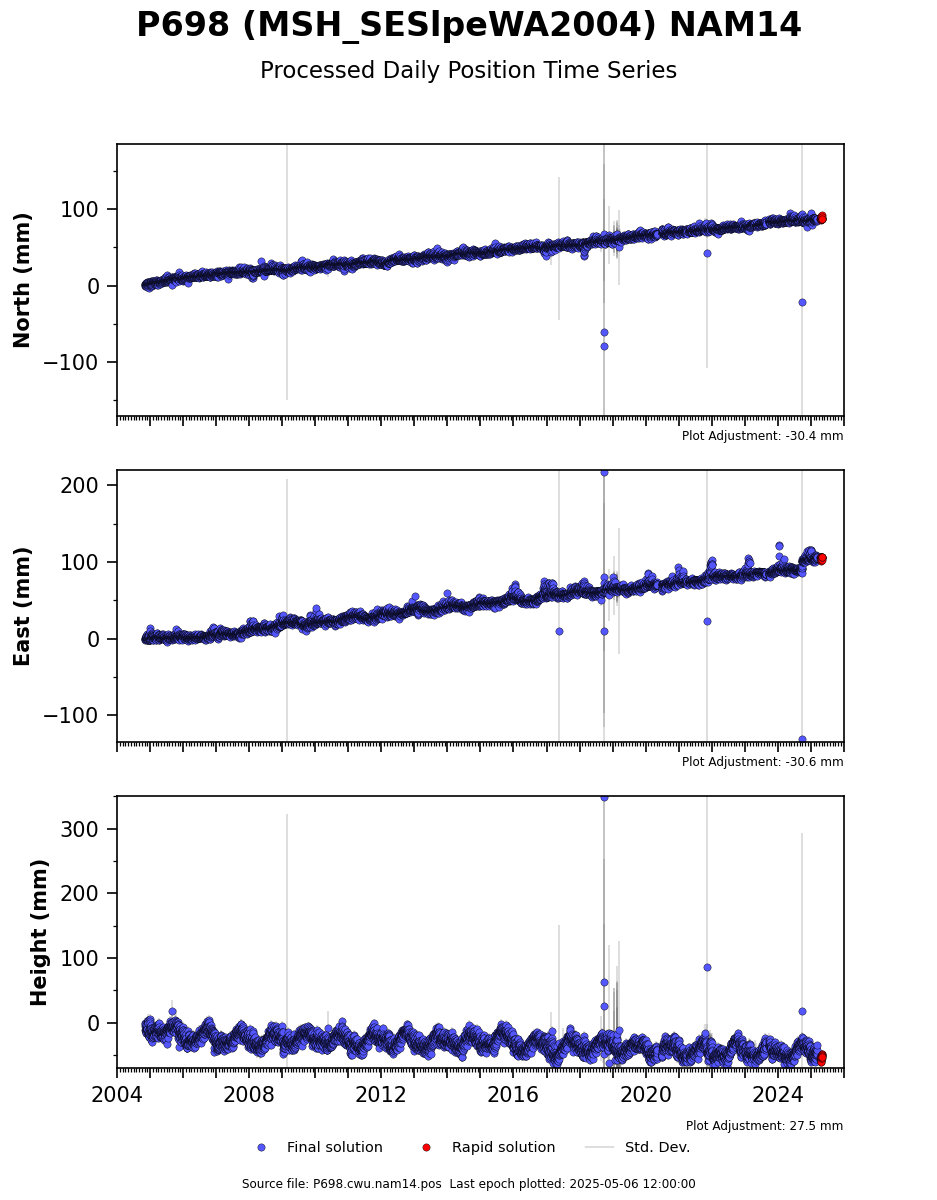