Questions for Chuck Meertens
How did you become a scientist/engineer?
I was in high school when the
1971 San Fernando earthquake hit Sylmar, CA. The earthquake bounced us around in our beds, smashed our house to pieces, filled the air with dust, triggered fires close to school, and caused landslides in the mountains. I was old enough to be curious, "Gee, what is this about?" It was a pivotal moment as I've been spending the rest of my life trying to figure this out.
Even before the earthquake, however, many things pointed to a career in technology or science. My father was an aerospace engineer, I had inspiring science teachers in middle school and high school, and my friends were also interested in science. Living near the ocean sparked an interest in marine biology and oceanography. I started college intending to major in oceanography, but my path changed when I took a course in marine geology soon after the theory of plate tectonics became dominant. I transferred to another college and majored in geology.
What is your job like?
As I was launching my career, we were using the
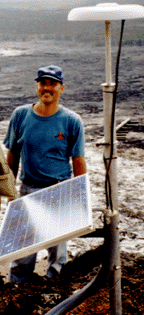
leveling technique for vertical measurements, but that was labor intensive and infrequent and missing any horizontal changes. In looking for better instrumentation, I helped develop specialized
tiltmeters (high precision levels) for use in a research project at Yellowstone. Then GPS came in and became the tool to use for studying long-term tectonics of continents moving as well as short-term seasonal motions.
Working on GPS projects gave me the opportunity to do 2 things I love to do: work with expensive toys and instruments, and travel around the world. I've worked on projects in New Zealand, The Philippines, Mexico, Galapagos Islands, and Alaska.
In recent years, my job has shifted more towards management rather than doing science. I now refer to myself as an accidental scientist.
What are you hoping to learn from your research?
What I really like to do is measure neotectonics—what's happening now and not just looking at what happened in the geologic past. And I've always been more interested in the measurement side of the science than of the motions themselves.
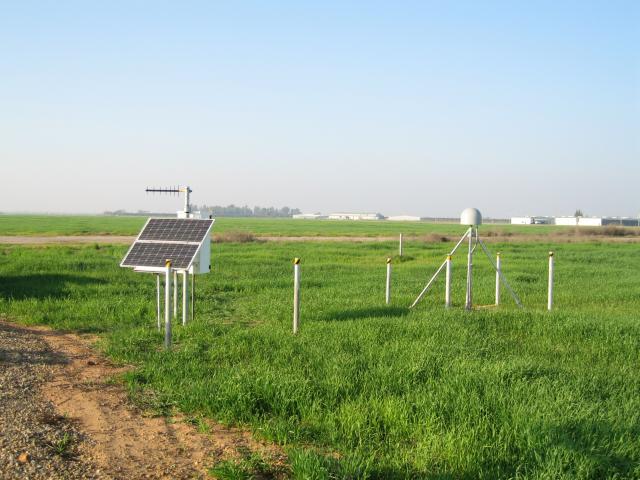
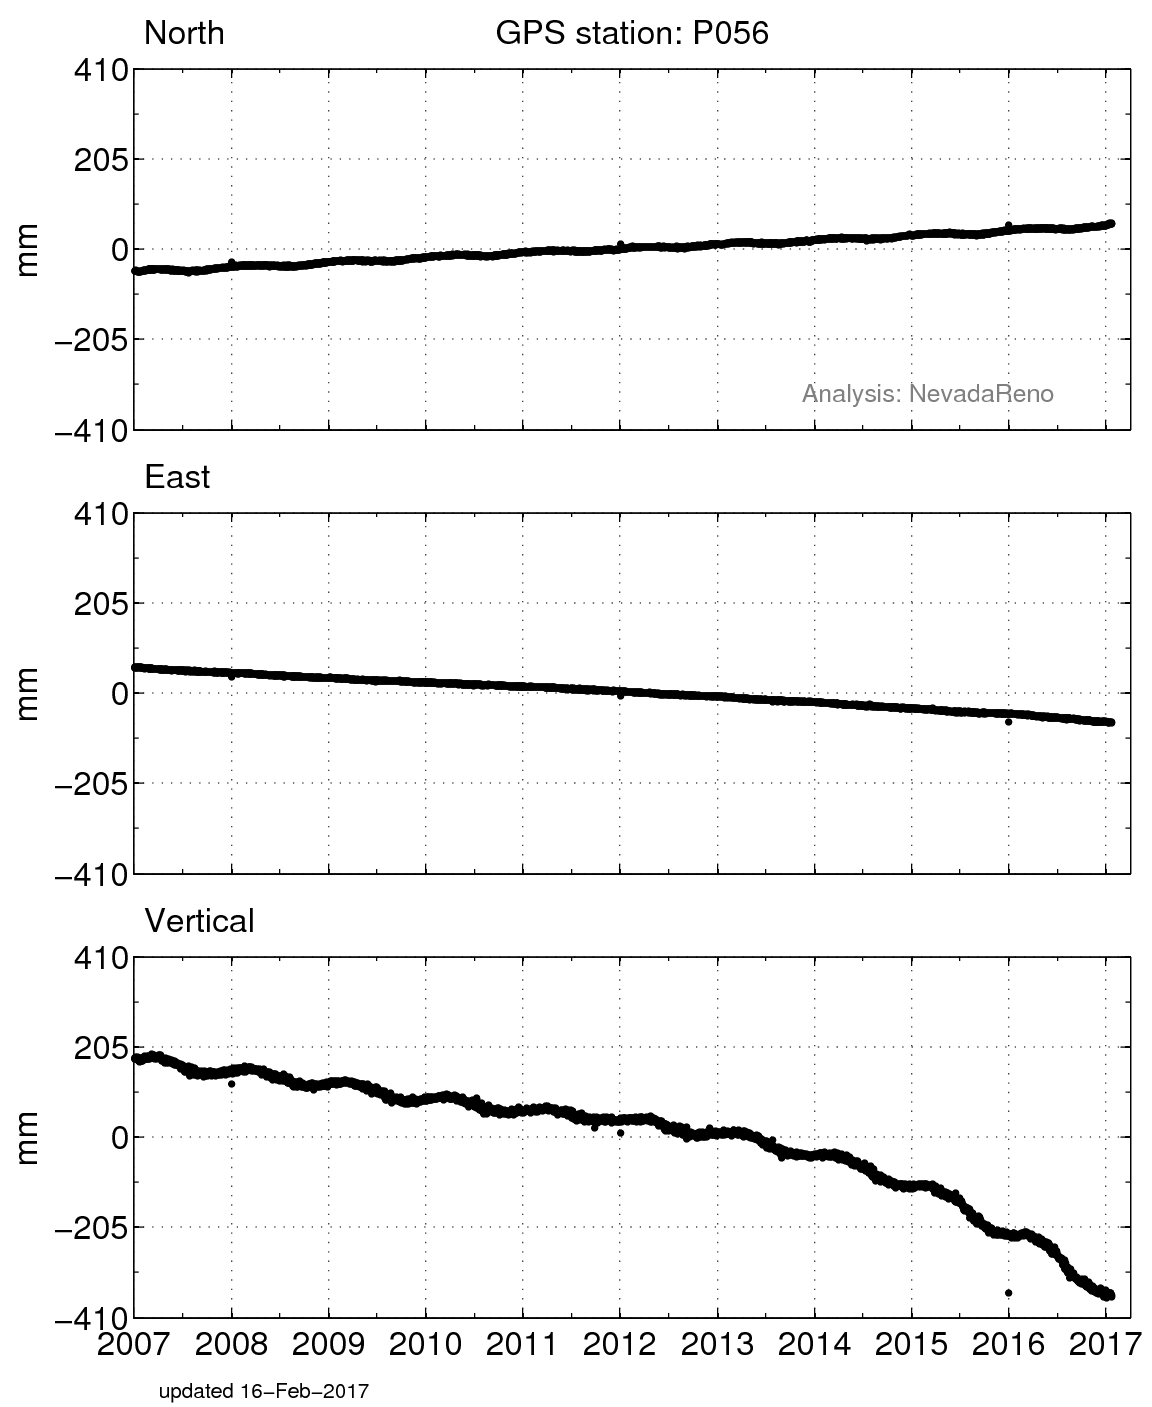
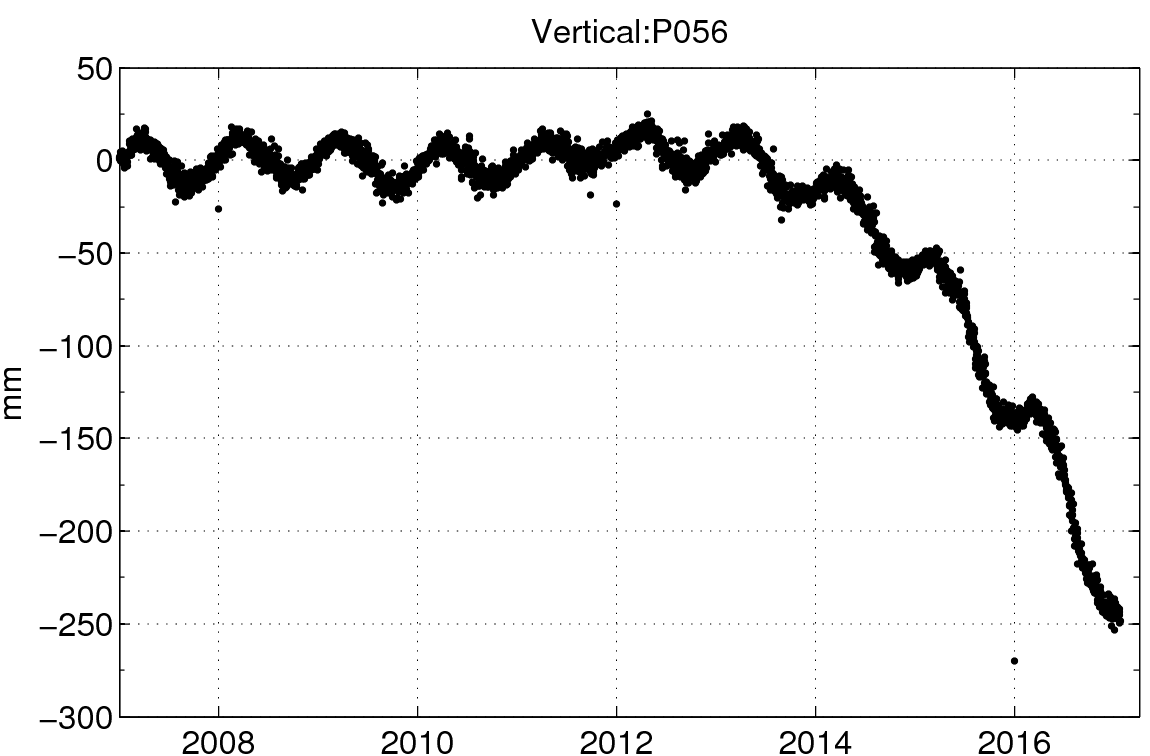
When you look at high precision measurements and see unexplained variability, you start to worry about the GPS station itself. Field engineers work very hard to anchor the stations and we refer to them as monuments. The stability of the monument is an engineering question, and if it's just noise in the data, it's not interesting. Looking at the readings from multiple stations, however, revealed seasonal patterns that we're able to model. It turns out that because we're able to model it, these are probably real signals that we're looking at that are of scientific interest, not poor design.
Of course, a few stations had subtle but noticeable deviations from the expected. With high-precision instruments, you are always reluctant to change any part of the equipment because that introduces variability. Finally, we changed the antennas and the problem was solved. The more you understand the things you expect to see, the more you can rule out the things you don't expect to see.
As a manager, I'm trying to build the infrastructure to do high precision positioning in real time. This would create opportunities, for example, to issue tsunami warnings after earthquakes or to shut down systems like trains entering a danger zone. Of course, we'd have to do this reliably—people are not too keen on false alarms.

 unavco.org.

 Spotlight Map
 GNSS Videos
 Funding and Acknowledgements