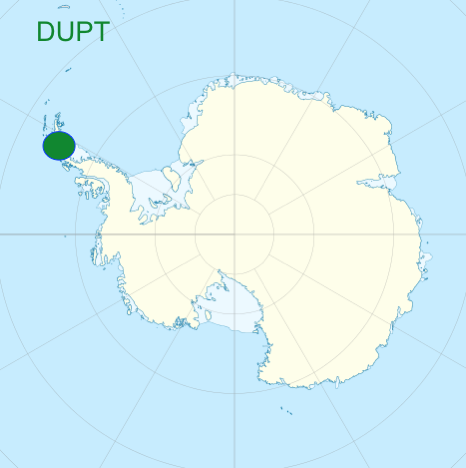
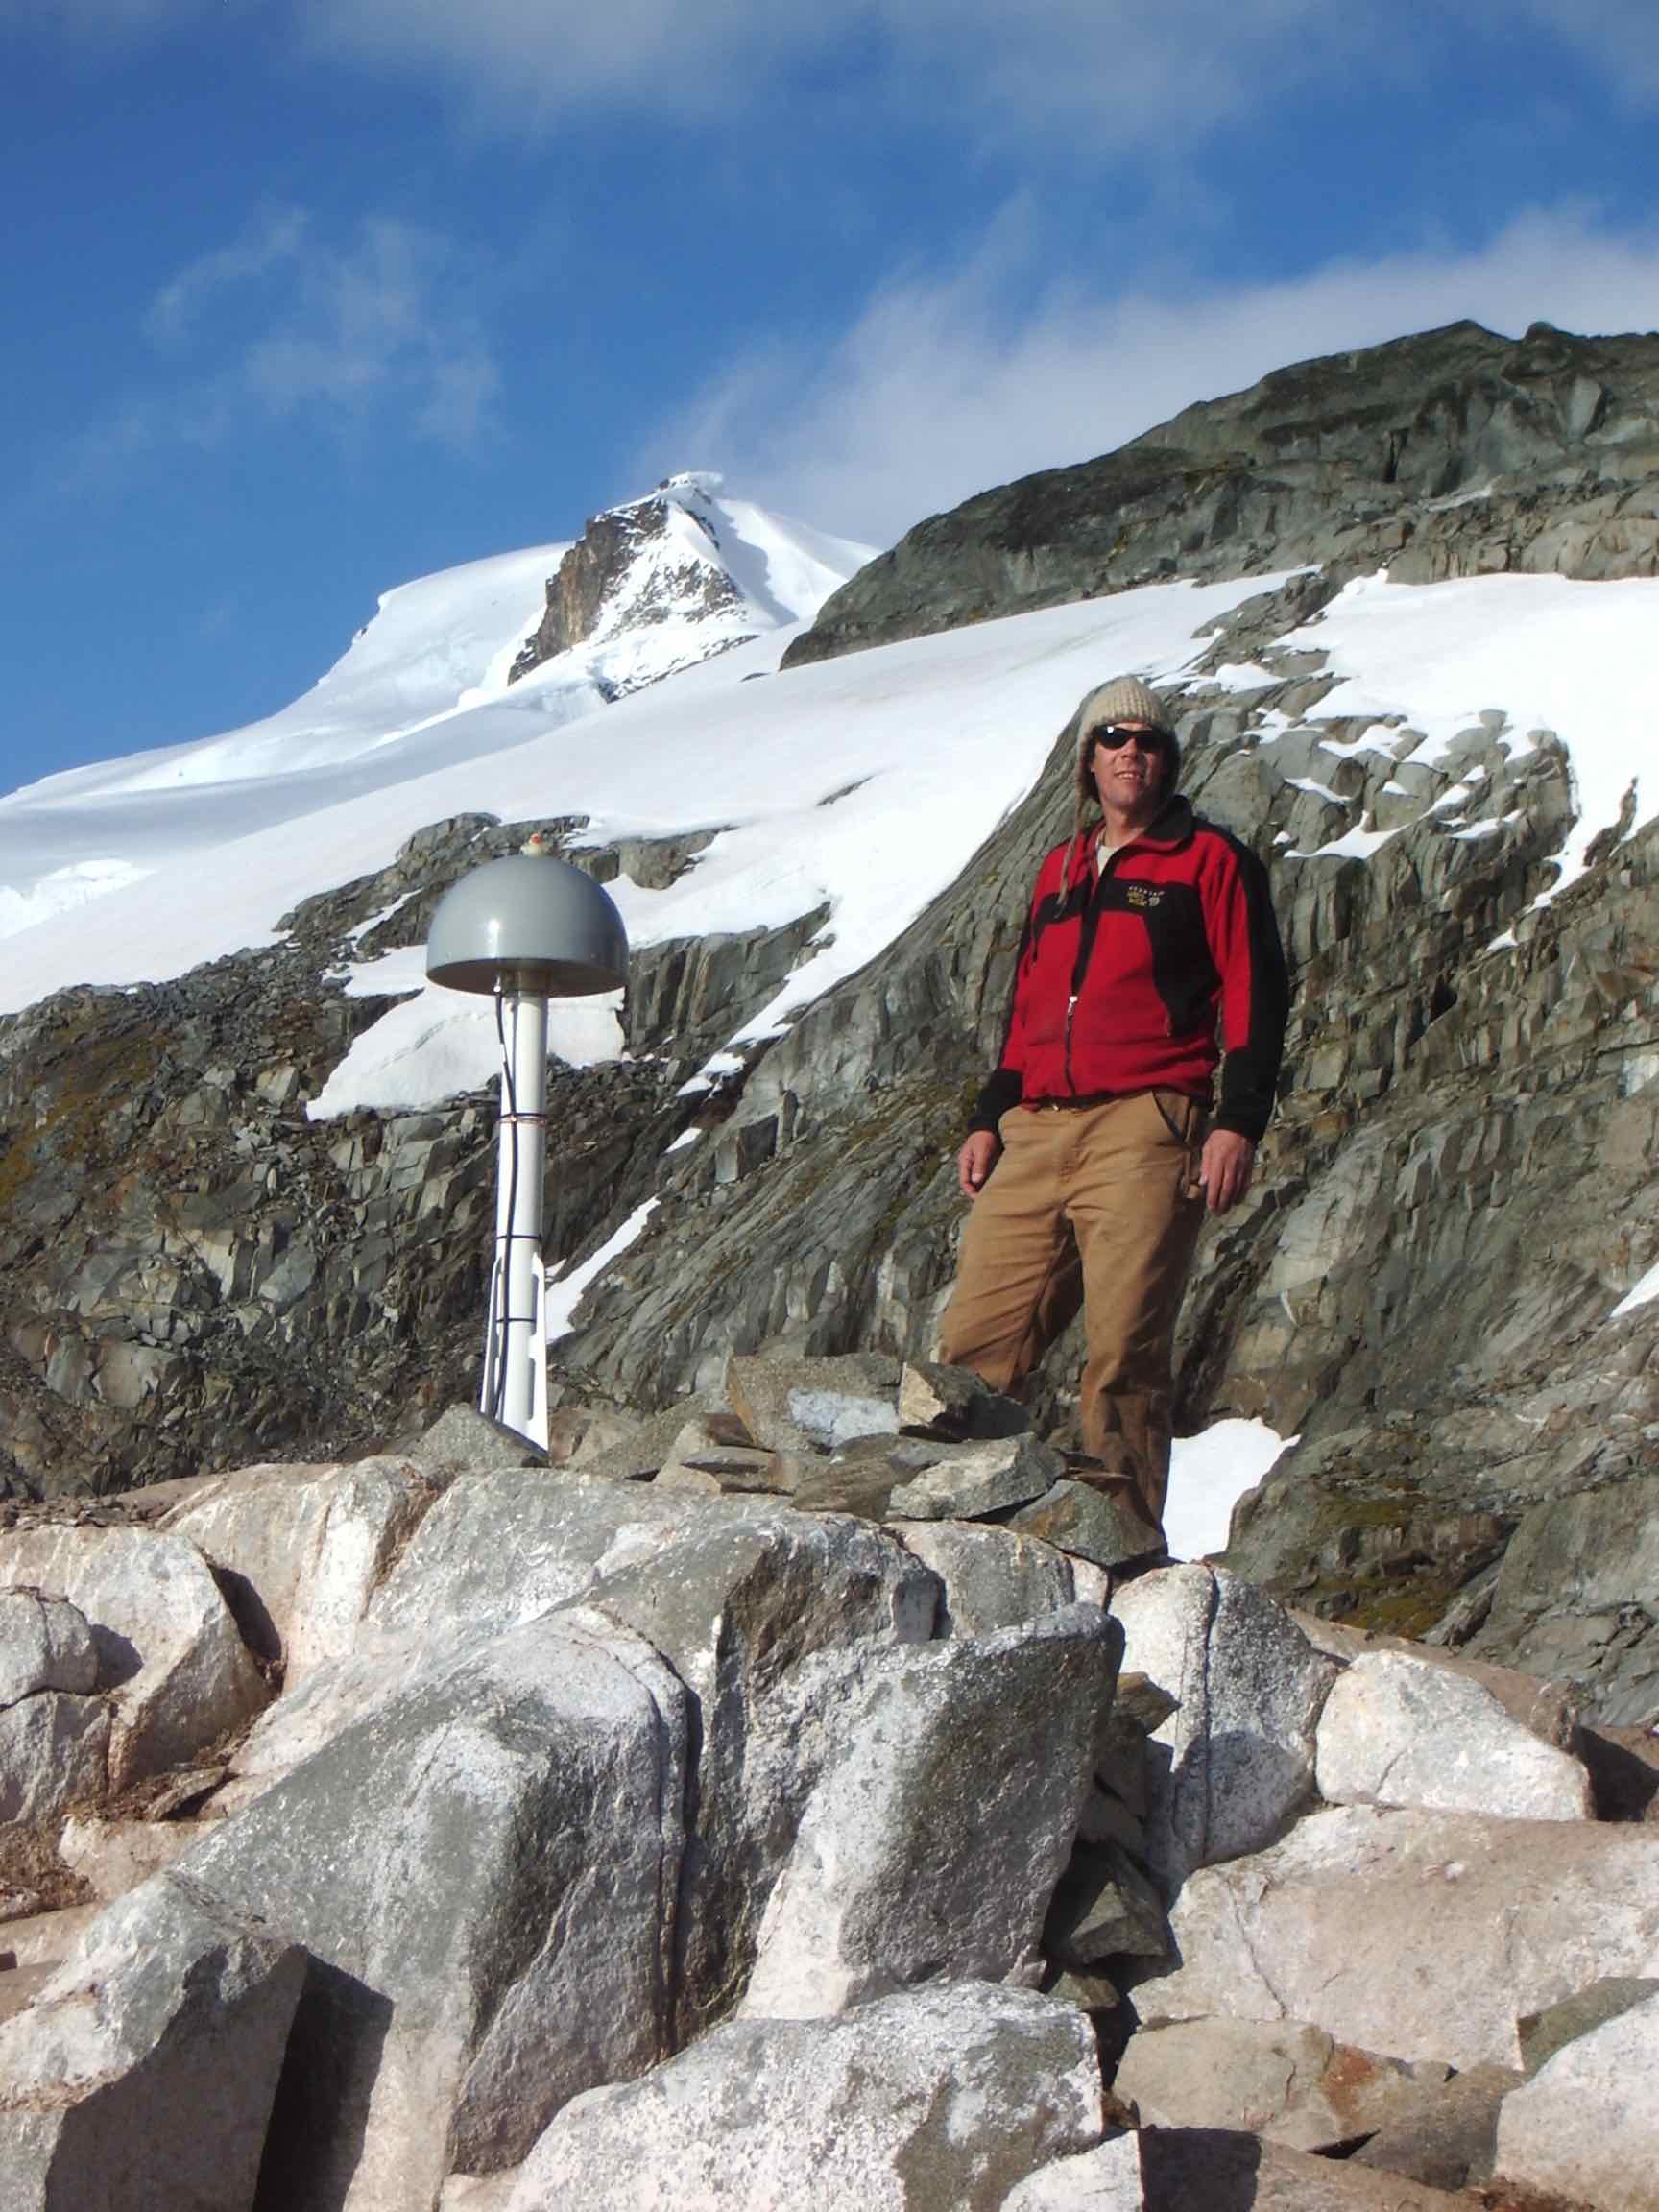
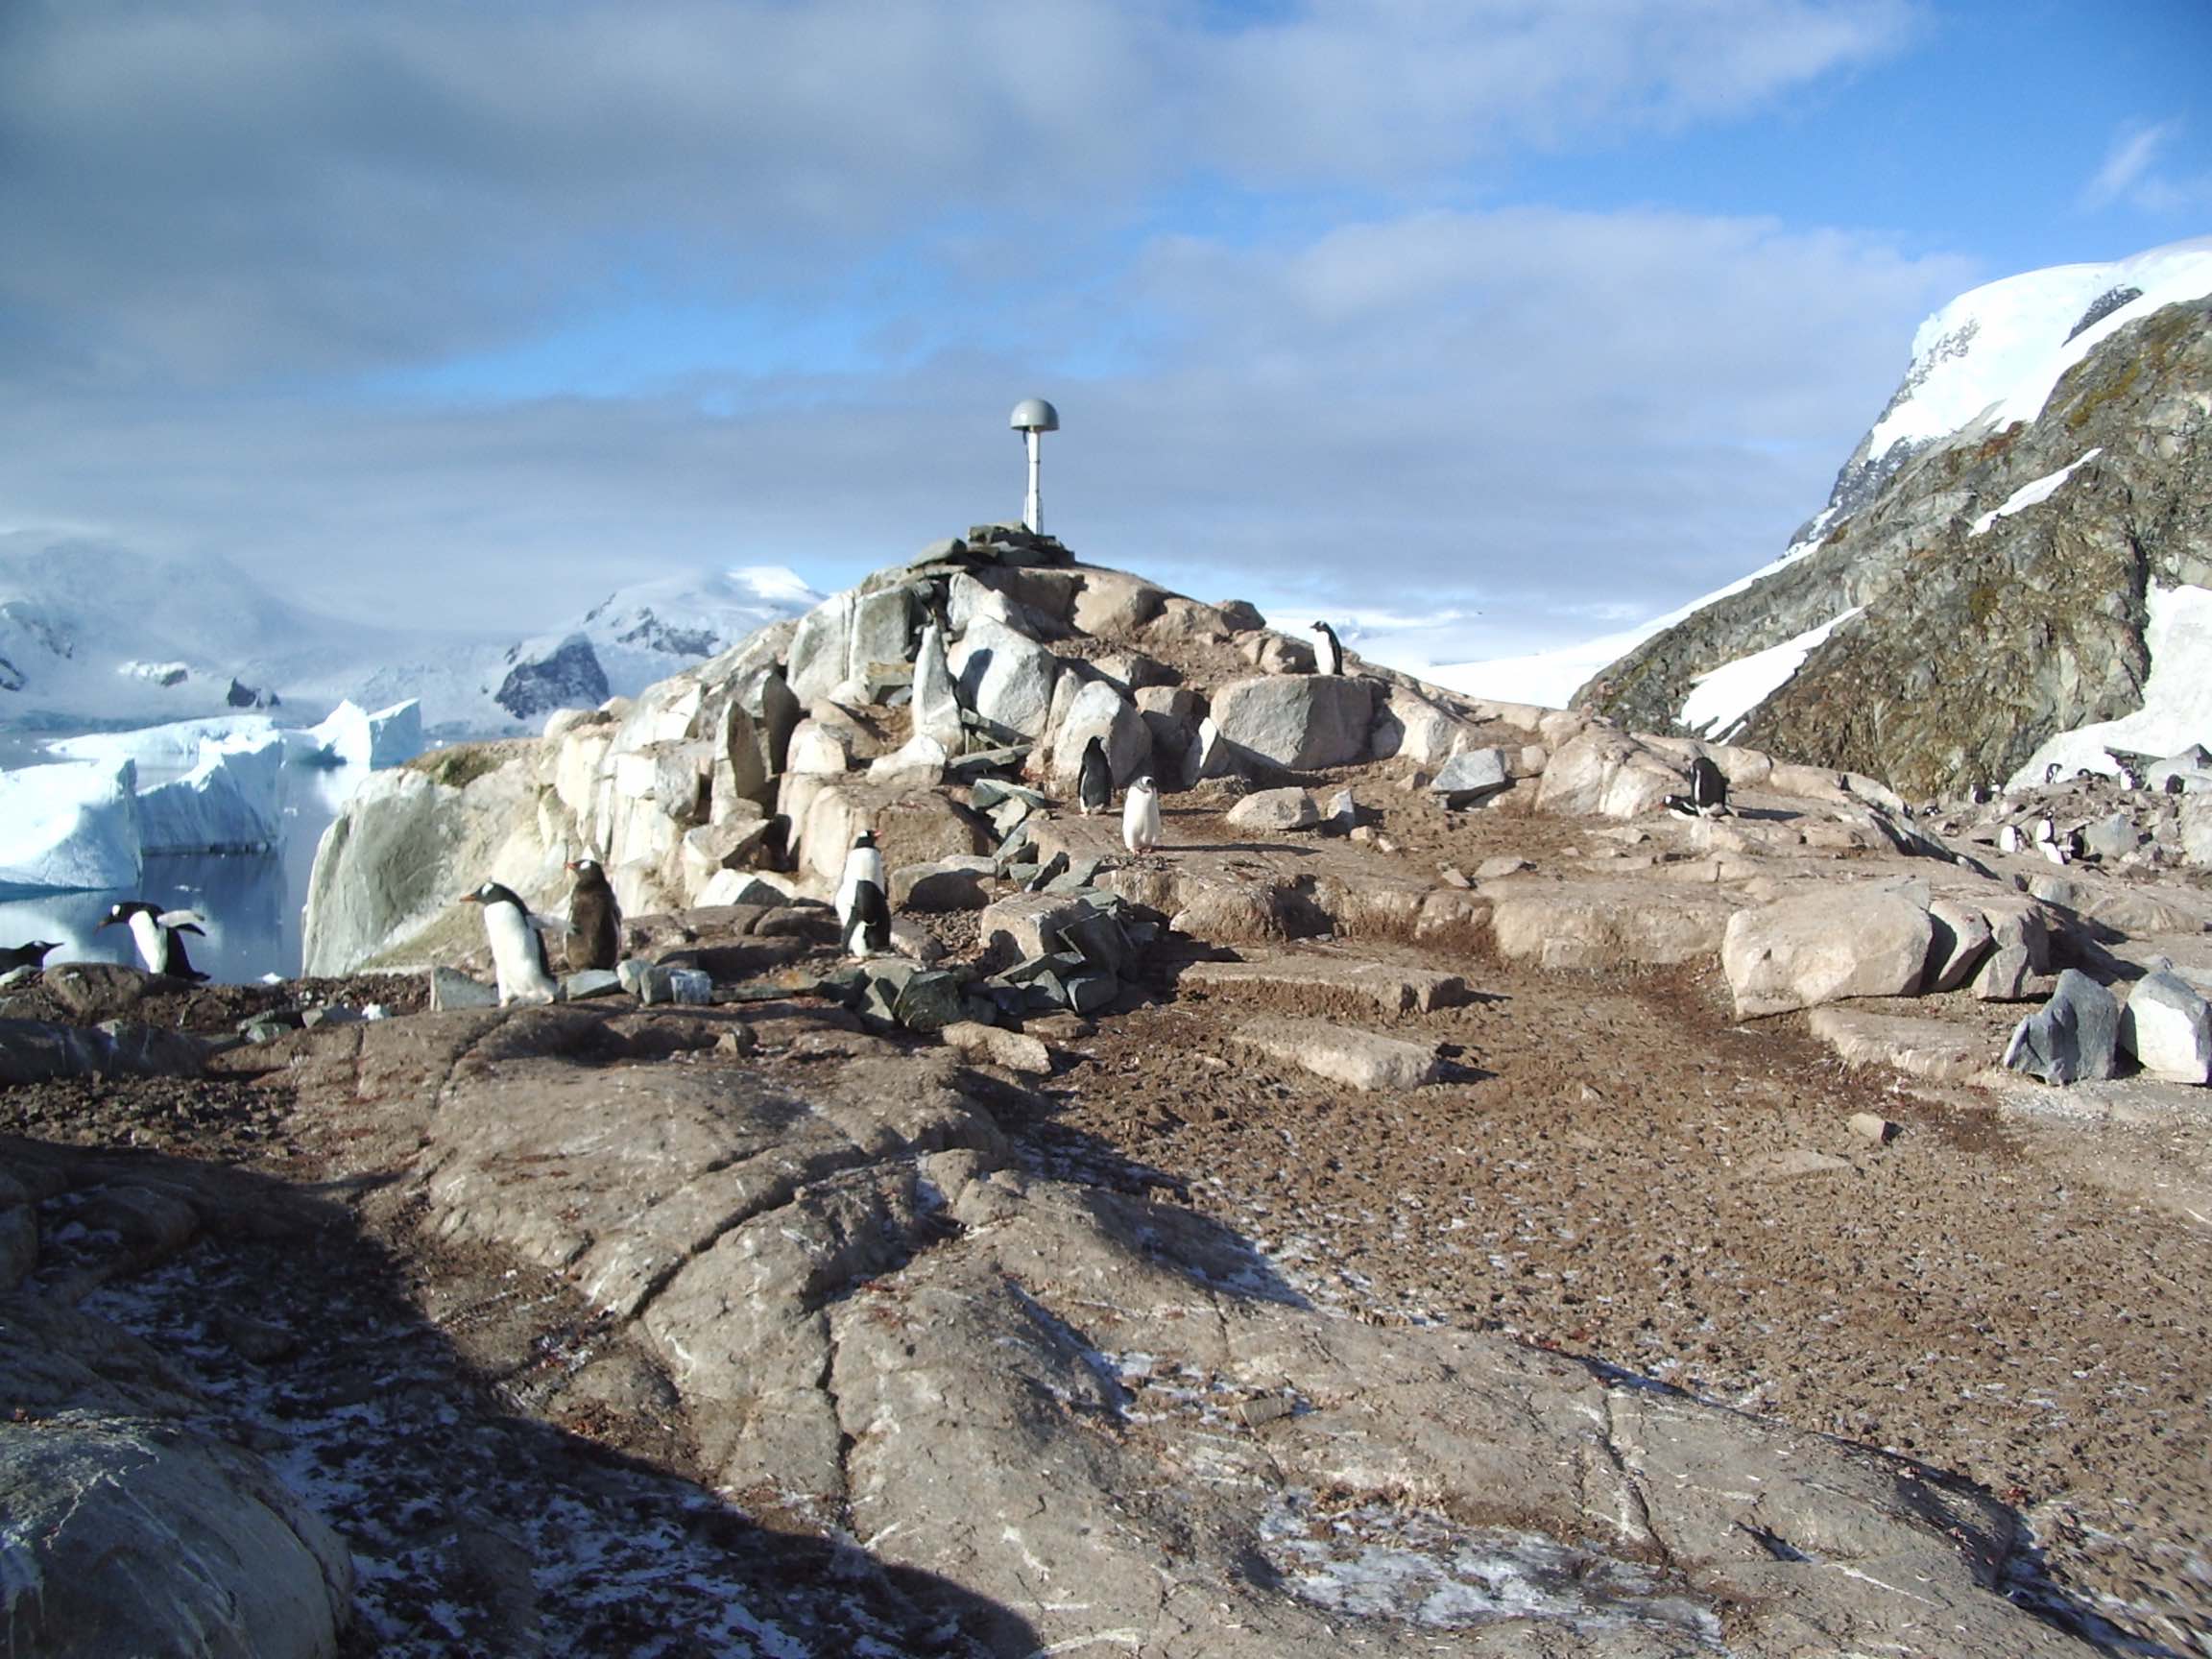
Science Spotlight

Station DUPT


Researcher: DUPT Maintenance Crew


The Duthiers Point GPS site was installed as part of International Polar Year activities.


Name: DuthiersPt
Country: Antarctica
Elevation: 43.8 m
Lat/Long:  -64.805 / -62.8169

GPS Research at Duthiers Point

DUPT is part of LARISSA, an NSF-funded research initiative to study environmental change in Antarctica's Larsen Ice Shelf System and its global change implications. The LARISSA project began in 2007 in response to the 2002 collapse of the Larsen B Ice Shelf. The sudden disappearance of ice provided an extraordinary opportunity to study an environment and ecosystem in rapid transition. Geoscientists and biologists have worked together for over a decade to understand the events leading up to this collapse and the impacts resulting from it.

The geodetic aspect of the LARISSA project aims to identify which portions of the glacial cover in the Antarctic Peninsula are losing mass to the ocean and at what rate. Research has shown that the Antarctic Peninsula is warming faster than any other region across the earth. After the break-up of the Larsen Ice Shelf in 2002 many regional glaciers began to flow rapidly into the sea. Measurement of the isostatic rebound in this part of Antarctica provides a precise tool with which to base ice mass change. This rebound effect can be measured with GPS instruments locked into ice free bedrock surrounding the area of interest. Coupled with satellite measurements, a very strong picture emerges about not only current ice dynamics, but past glacial coverage as well.

Please see Grace Nield's spotlight for additional information.

This summary is based on information from the UNAVCO website. Photo credits: UNAVCO.

Figure 1. View from DUPT.


Figure 3 Member of the installation team.


Figure 5. By combining sea level estimates for multiple GPS satellites (as shown in Figure 4), the GPS instrument becomes a tide gauge. Credit: K. Larson.


Figure 2 DUPT time series defined in the ITRF2008 reference frame. Note, in particular, the rapid vertical motion at this site. The GPS data are archived at UNAVCO. For help interpreting the graphs, see the GPS Data page.


Figure 4 GPS signal to noise ratio data from a satellite that is setting over the ocean are shown in the top panel. Below is a periodogram that extracts the vertical height of sea level with respect to the GPS antenna. Credit: K. Larson


Figure 6. View from the east.


Last modified: 2019-12-26  16:24:56  America/Denver  


Please send comments and corrections to educationunavco.org.

Copyright © 2012 - 2024 UNAVCO and the GPS Reflections Research Group.
All Rights Reserved.

Funding and Acknowledgements.