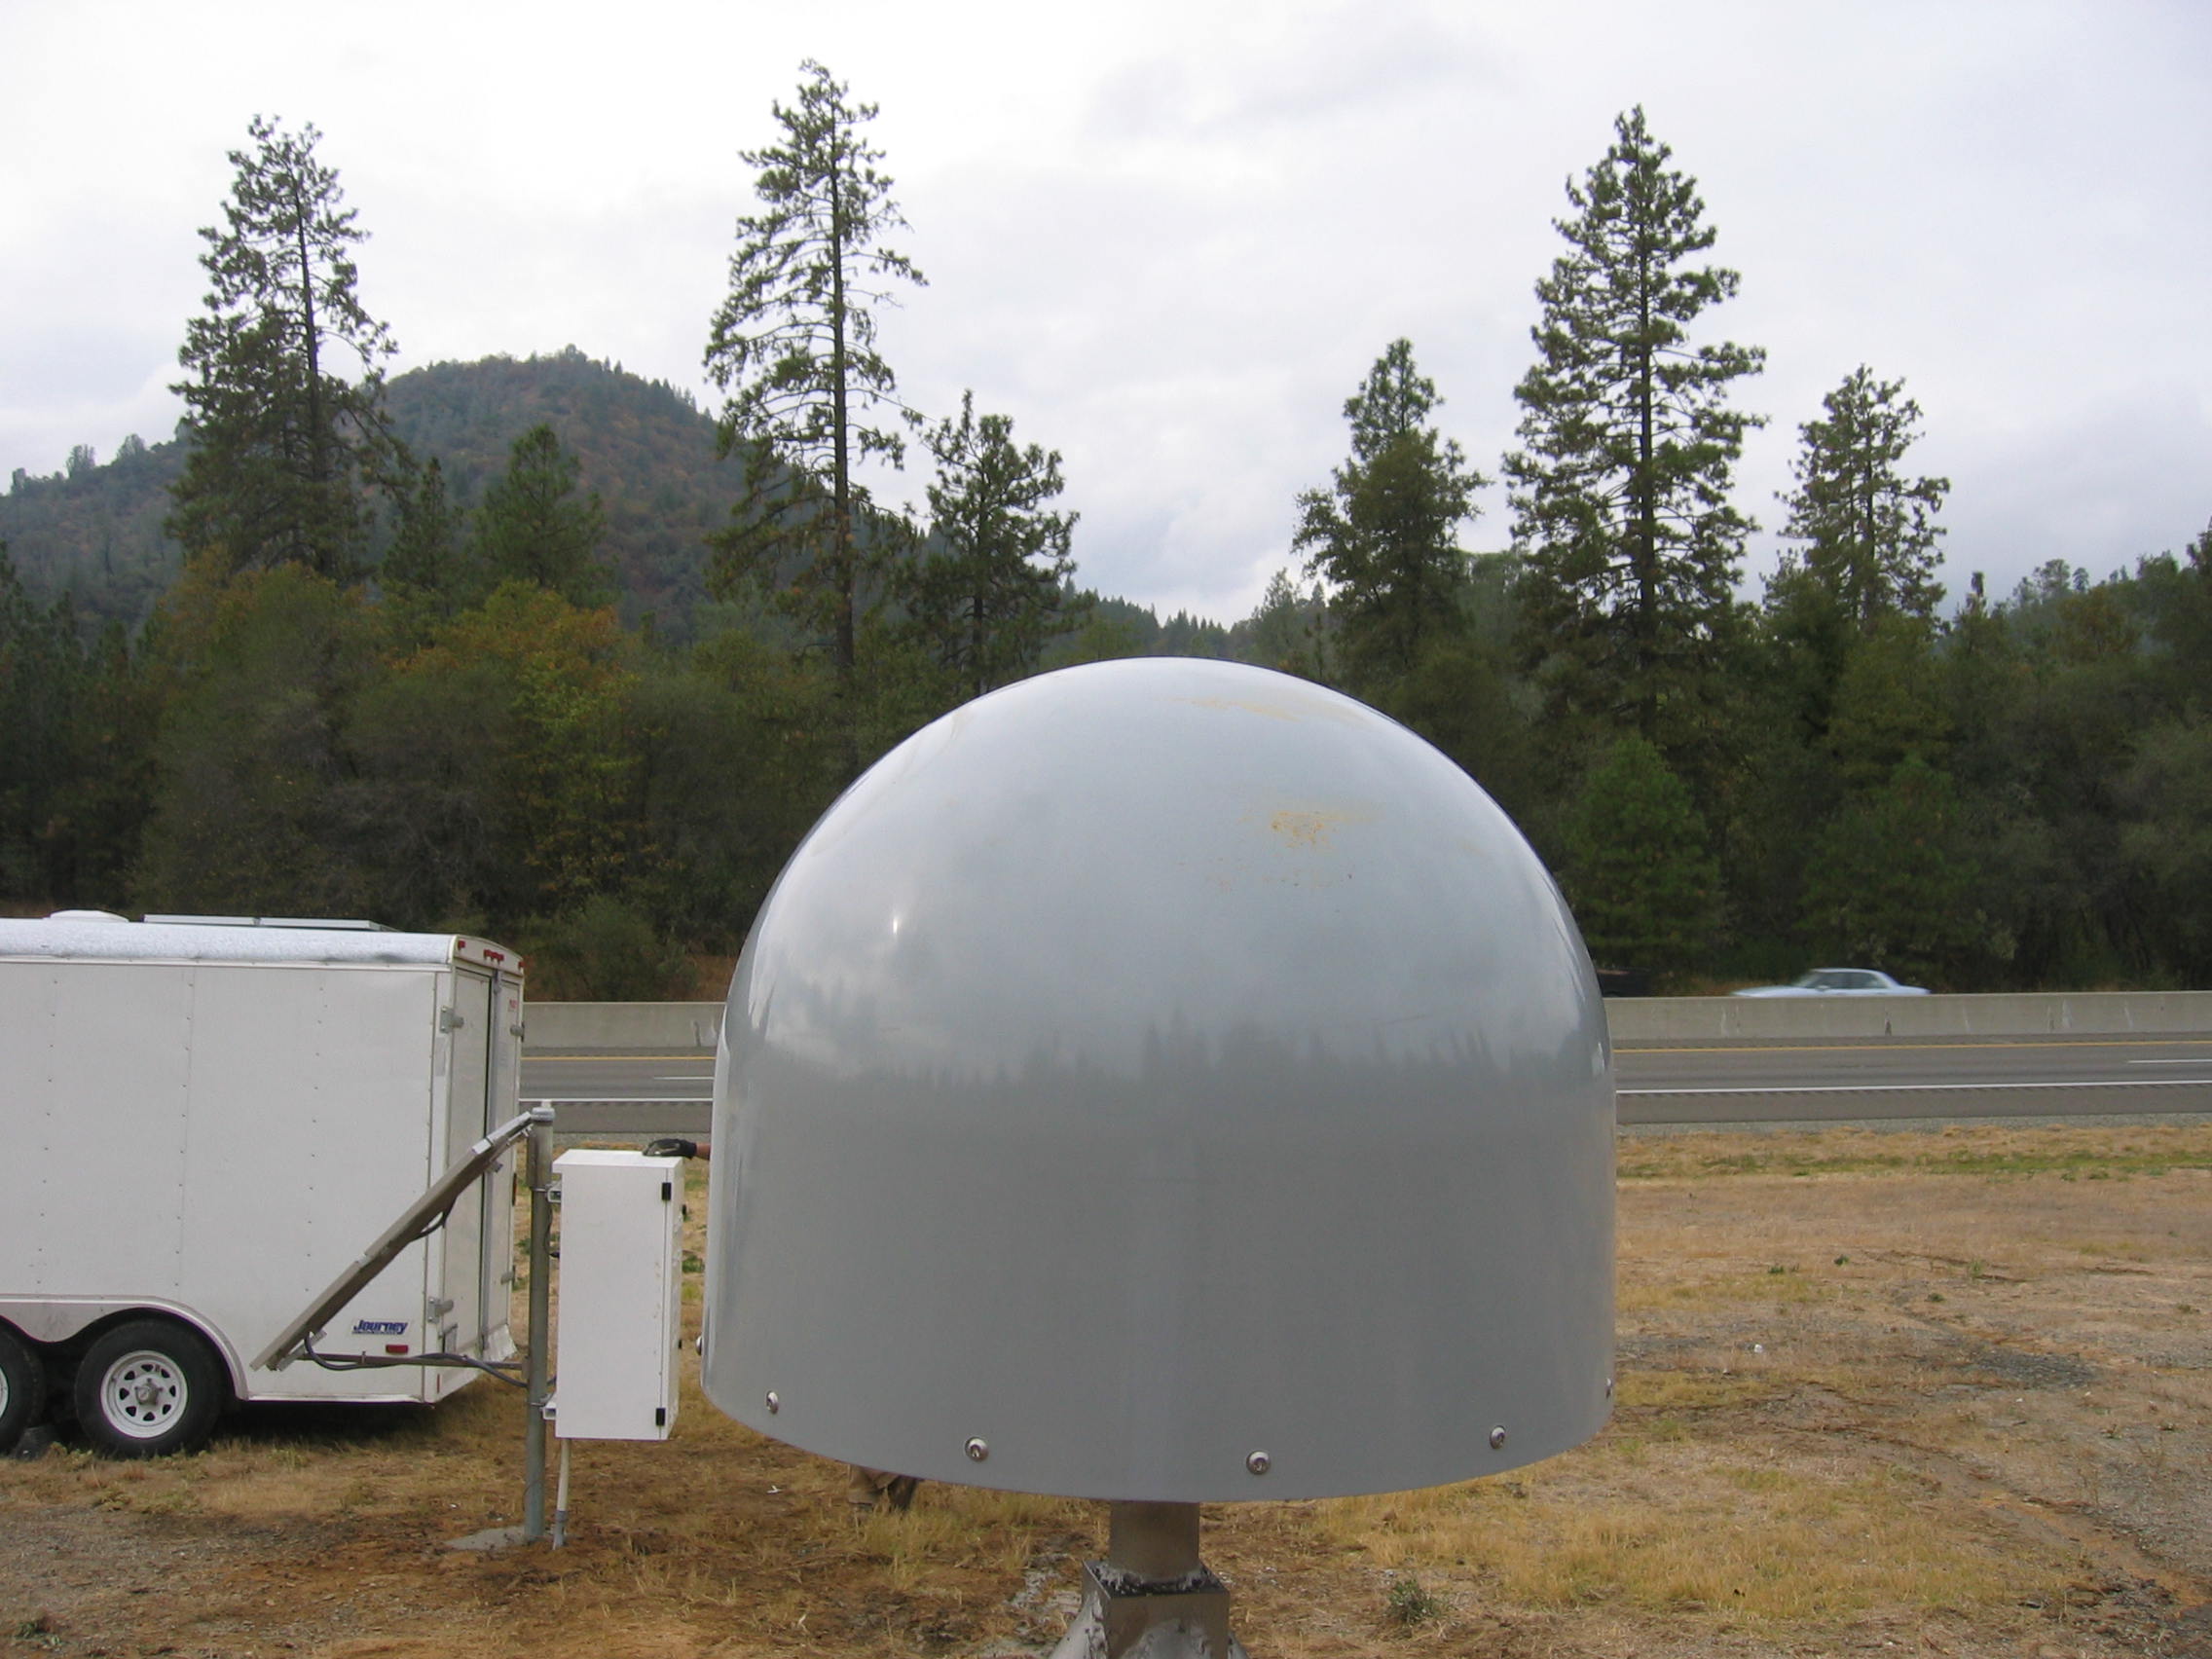
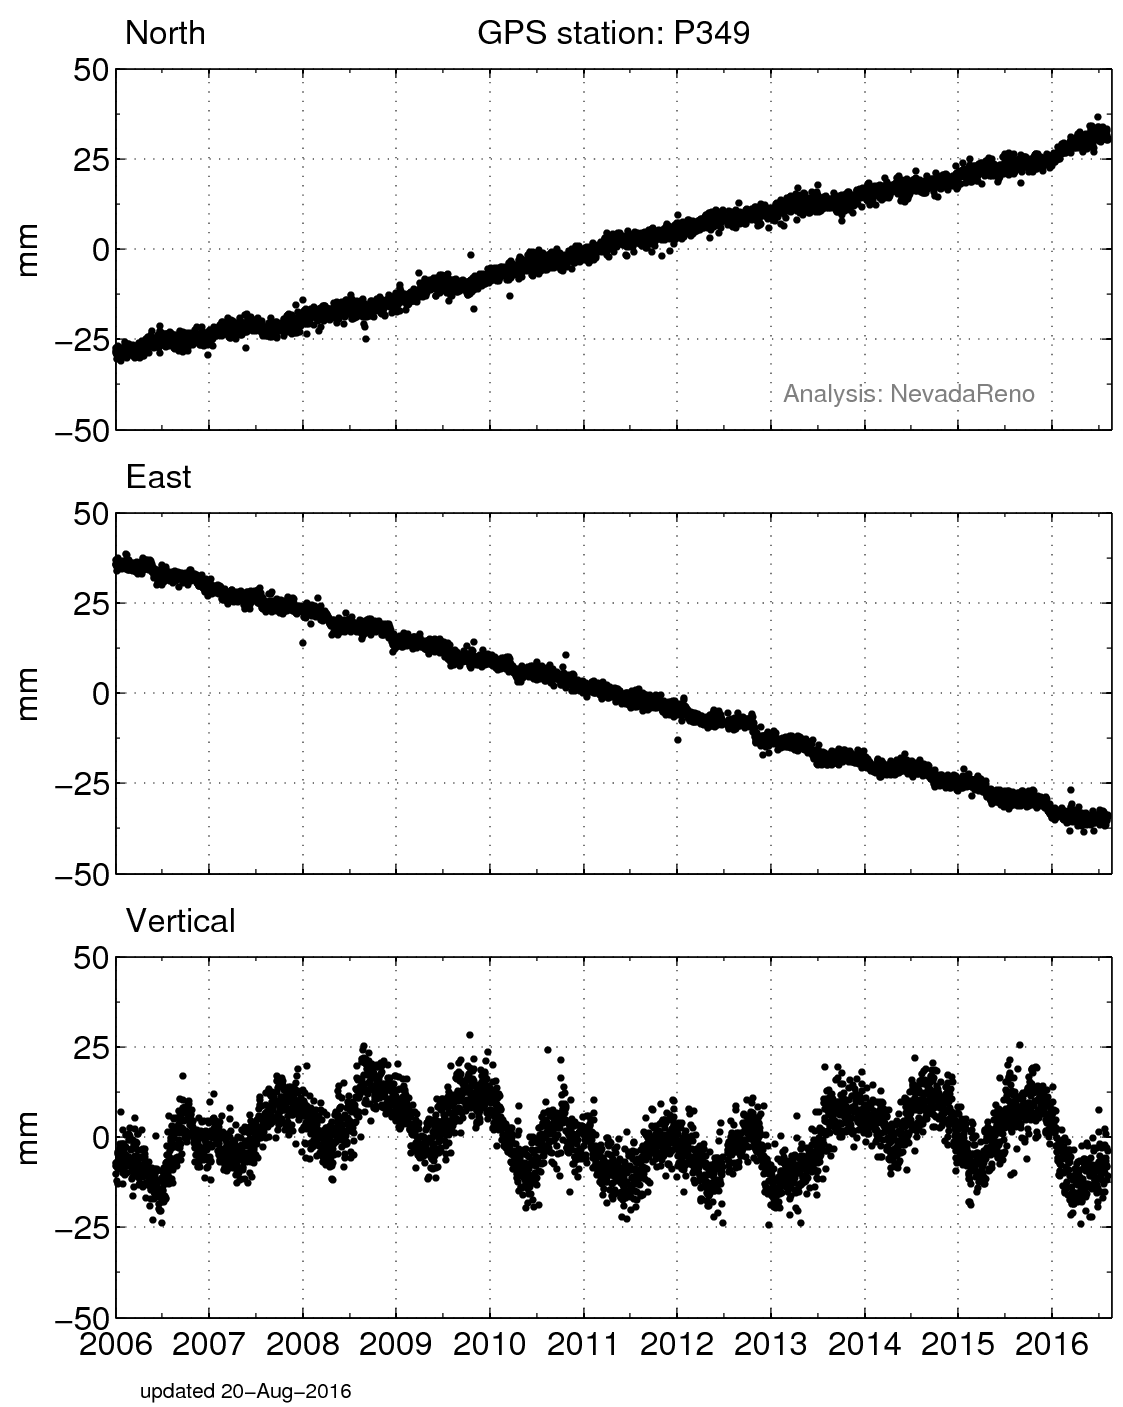
Science Spotlight

Station P349


Researcher: John Wahr
University of Colorado

This site is dedicated to John's memory. He was a towering figure in geodesy and a wonderful human being.K.L.


P349 is located on the southern shore of Lake Shasta.


Name: WONDERLAND
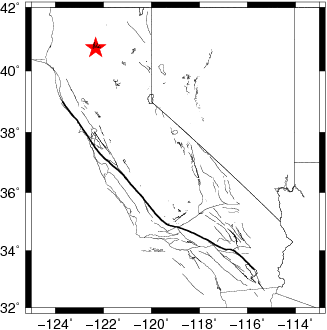
State: CA
Country: United States
Elevation: 275.4 m
Lat/Long:  40.7311 / -122.3194

Crustal Loading from Lake Shasta

Lake Shasta is the largest man-made lake in California. Water flowing out through the dam is used for irrigation and to produce electricity, and the ability to let water out through the dam at a controlled rate allows water managers to reduce the dangers of downstream flooding. The lake level rises and falls both because of seasonal and long-term changes in rainfall, and because of controlled releases through the dam. When the lake level rises, there is more pressure on the surface of the underlying Earth, and the Earth's surface beneath the lake and in the surrounding region gets pushed downwards. Conversely, when the lake level falls, the Earth's surface rises.

Figure 3 shows, in black, how the lake level has varied between 2006 and 2011. There are large seasonal variations, as well as a prolonged dip between mid-2007 and mid-2010, which coincided with a serious drought in northern California. The orange line is a smoothed version of the black points, included to emphasize the dip. Figure 4 shows, in black, measurements of the vertical position of the ground observed by a GPS receiver (P349) located 2 km south of the lakeshore. Again, the orange line is a smoothed version of the black points. Figure 4 shows a positive bump between mid-2011 and mid-2010, corresponding to the dip in the lake level: when the lake level fell, the ground rose; and vice versa. In fact, a careful comparison of the two figures shows that this anti-correlation between lake level and ground motion occurred even for the large seasonally varying terms: the lake goes up, the ground goes down; and vice versa.

Figure 1. Lake Shasta, with Mount Shasta in the background.


Figure 3. Level of Lake Shasta for the last 6 years (black). Smoothed data are shown in orange.


Figure 5. Position changes for P349 in a North American fixed reference frame. (For help interpreting the graphs, see the GPS Data page.)


Figure 2. Loads on the Earth cause the ground to deform. The horizontal and vertical positions of GPS stations near the load are also changed. Scientists can use their knowledge of how the Earth deforms to predict these GPS displacements.


Figure 4. Daily GPS vertical coordinates in black (smoothed data are shown in orange).

Spotlight Questions

  • Can you think of any other large water bodies that would depress the Earth's crust the same way as we see for Lake Shasta?
  • Would you expect to see seasonal variation in surface loading for these other large water bodies?

Last modified: 2019-12-26  16:24:52  America/Denver  


Please send comments and corrections to educationunavco.org.

Copyright © 2012 - 2024 UNAVCO and the GPS Reflections Research Group.
All Rights Reserved.

Funding and Acknowledgements.