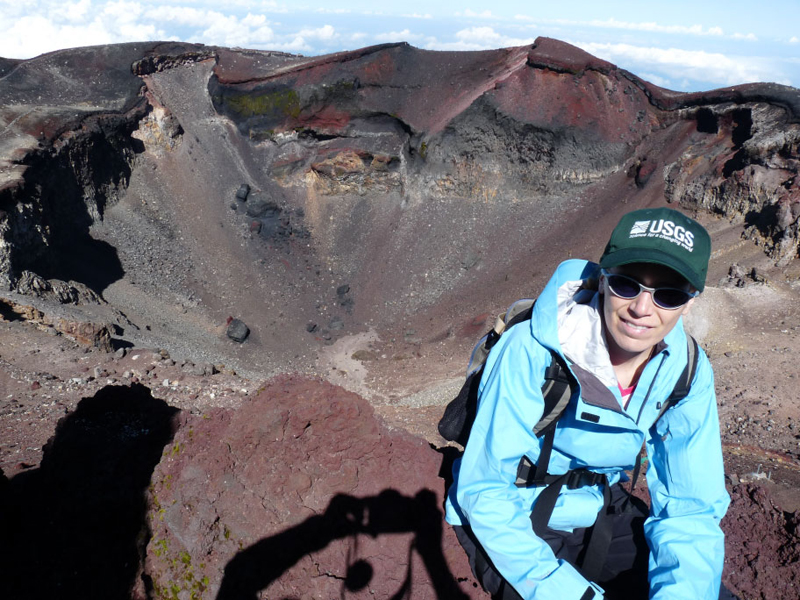
Questions for Jessica Murray
How did you become a scientist/engineer?
My father is a geologist, so I was aware of Earth science as a profession from an early age. However, it was not until I began taking geology courses in college that I became hooked. Learning about the physical processes that lead to what we observe in nature, developing and testing hypotheses, and having the opportunity to do field work in interesting places throughout the world all attracted me to a career in Earth science. It was also very important to me for my work to have direct relevance to the public at large, and this led me to choose a graduate school program in which I specialized in studying the way the Earth's crust deforms due to earthquake faults.
What is your job like?
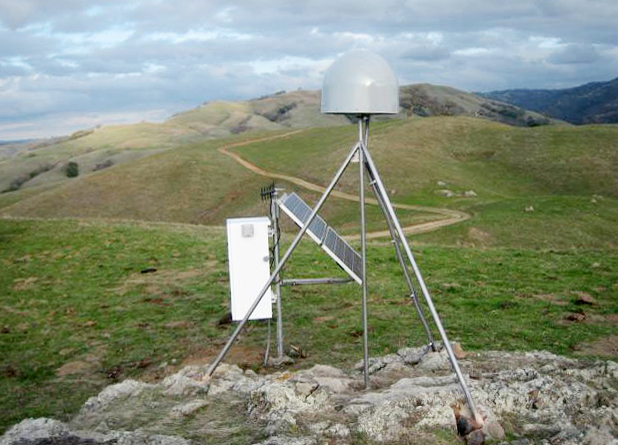
I am a Research Geophysicist at the U.S. Geological Survey where I lead a group of scientists and staff who collect, process, and interpret data from GPS instruments as well as strainmeters and creepmeters. We use these data in seismic hazard assessment, earthquake response activities, and basic research. My research includes estimating the rates at which strain accumulates in the Earth's crust during the time between earthquakes, investigating motion that occurs on faults due to earthquakes and other processes, and developing ways to monitor continuously recorded GPS data for anomalous changes that may be related to fault movement. I communicate the results of this work through oral presentations and written publications. In addition to research, I plan the overall goals for my group; work with group members to figure out the best strategies for achieving them; assess the financial and personnel resources needed; and develop collaborations with universities, other government agencies, and the private sector to meet these goals.
What are you hoping to learn from your research?
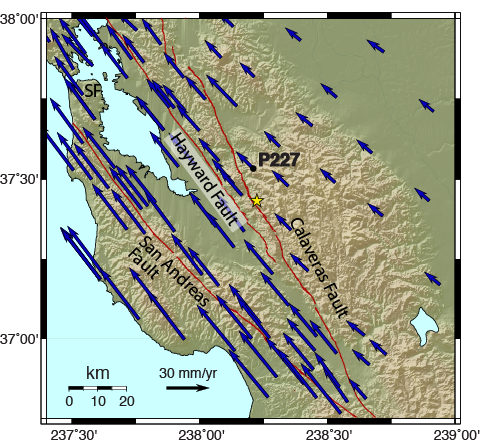
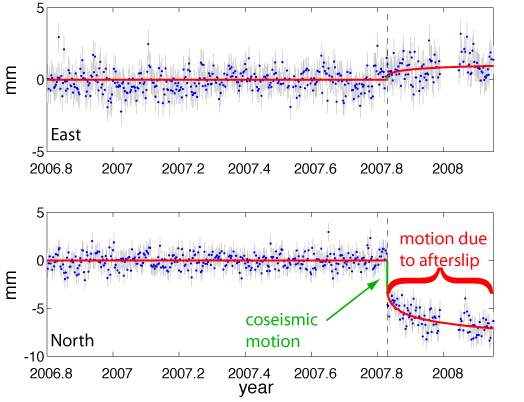
GPS can record motion of the Earth's crust that is too slow to generate seismic waves and therefore can't be seen with seismometers. In this way GPS gives us a window into the rate of relative movement of two sides of a fault, called the slip rate, that must be accommodated over time. Using GPS we can also study processes that cause a fault to move slowly (at rates of mm or cm/yr). This can happen in response to an earthquake or spontaneously during the time between earthquakes; some faults move slowly all the time. GPS measurements of crustal motion provide important data for developing more accurate seismic hazard assessments and may eventually help us to better understand the conditions under which faults move quickly in an earthquake causing catastrophic damage versus gradually in a way that releases strain without shaking that can be felt.

 unavco.org.

 Spotlight Map
 GNSS Videos
 Funding and Acknowledgements