Questions for Roland Bürgmann
How did you become a scientist/engineer?
As a kid, I always liked science, but didn't really think of it as a job possibility. It seemed like science was something you do for fun, not for work. Near the end of high school I was wondering if I should go on to study history or something related to the environment. So, I didn't really know exactly what was right for me, but decided to give geology a try.
When I started studying at the University of Tübingen in Germany, I was most interested in geochemistry, but through the influences of mentors and teachers, my interests focused in on structural geology and tectonics, and eventually on active tectonics and geodesy. It was most important to take opportunities to get involved in active research and get to work with scientists, early on. My research mentors freely shared their excitement and insights, and I learned that one doesn't have to be superhuman to do science or to have good ideas. As a professor, I now get to do science for fun and for work.
What is your job like?
As scientists, we never stop learning and studying. I get to spend substantial amounts of time reading and thinking about science others have done in research papers or learn about their work at scientific conferences. I also spend a lot of time talking about science. Part of my job is teaching courses at various levels. I also have a great time talking science with my students and postdocs, both in seminars and frequent one-on-one discussions of ongoing research projects.
What are you hoping to learn from your research?
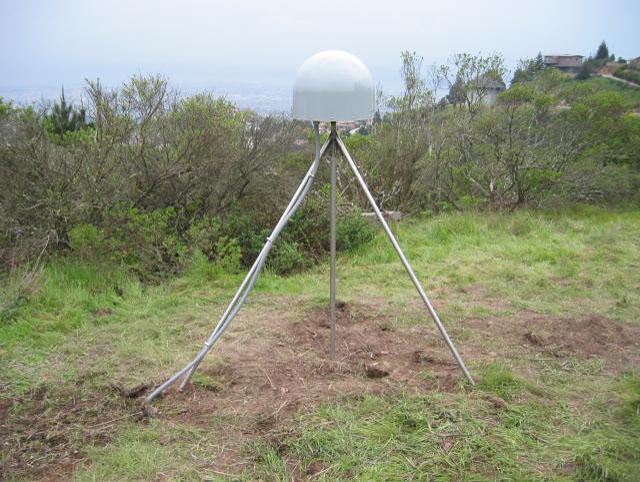
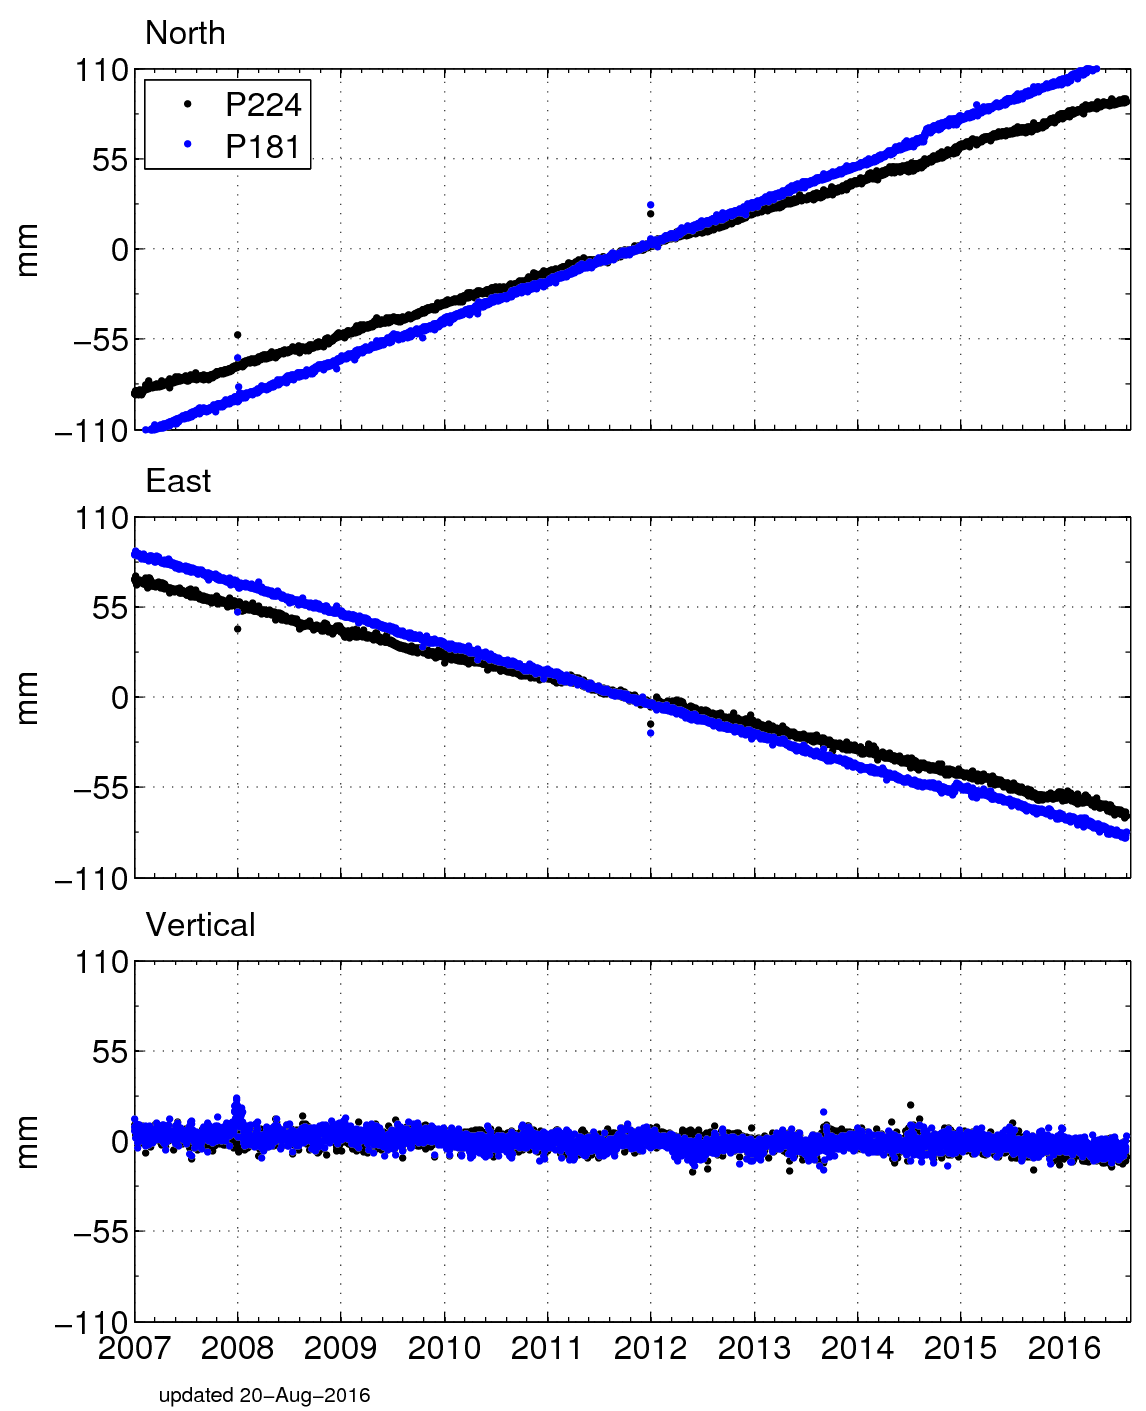
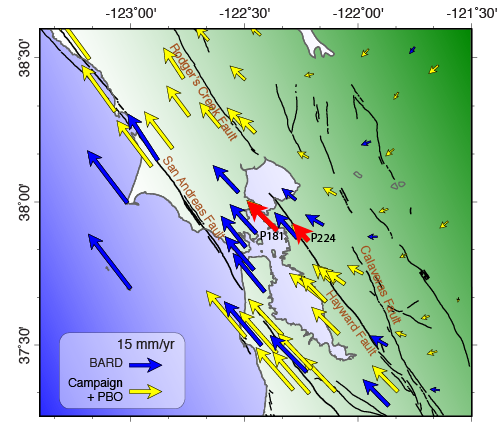
Together with my students, postdocs and collaborators I study active fault systems, volcanoes and landslides. We use the Global Positioning System (GPS) and Synthetic Aperture Radar Interferometry (InSAR) to measure active surface deformation of these systems and complement these data with seismologic and geologic observations. This work relies on increasingly sophisticated models to better understand the mechanics of these dynamic systems. Recent research projects of the Active Tectonics group at University of California, Berkeley, focus on the active earthquake cycle and post-earthquake deformation in California, Tibet, Sumatra and Japan, volcanic activity on the Big Island of Hawaii and active landslides in the San Francisco Bay Area and in Colorado.

 unavco.org.

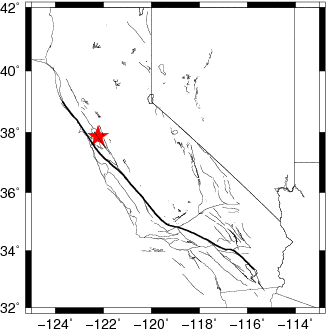
 Spotlight Map
 GNSS Videos
 Funding and Acknowledgements