Science Spotlight

Station FARB


Researcher: Ingrid Johanson
University of California, Berkeley

I've always tried to do the things I thought were the most exciting and find out more about the things I thought were the most interesting.


The FARB GPS antenna is close to the ground, and protected by a clear cover called a radome to, among other things, keep birds from nesting in it.


Name: Farrallon
State: CA
Country: United States
Elevation: -21.7 m
Lat/Long:  37.6972 / -123.0008

Pacific Plate Motion

In Northern California, the San Andreas Fault is located very close to the coast for much of its length. This means that most of the GPS data we have is from one side of the fault, which is only half the picture! The Farallon Islands are a chain of rocky islands made from the same granite (Salinian) as the Sierra Nevadas. The Farallons were separated from the Sierra Nevadas 10-20 million years ago and have been carried north up the coast with the Pacific Plate. Now a National Wildlife Refuge, the Farallon Islands give us our best estimate for current motion on the Pacific plate by providing a home for an offshore GPS station.

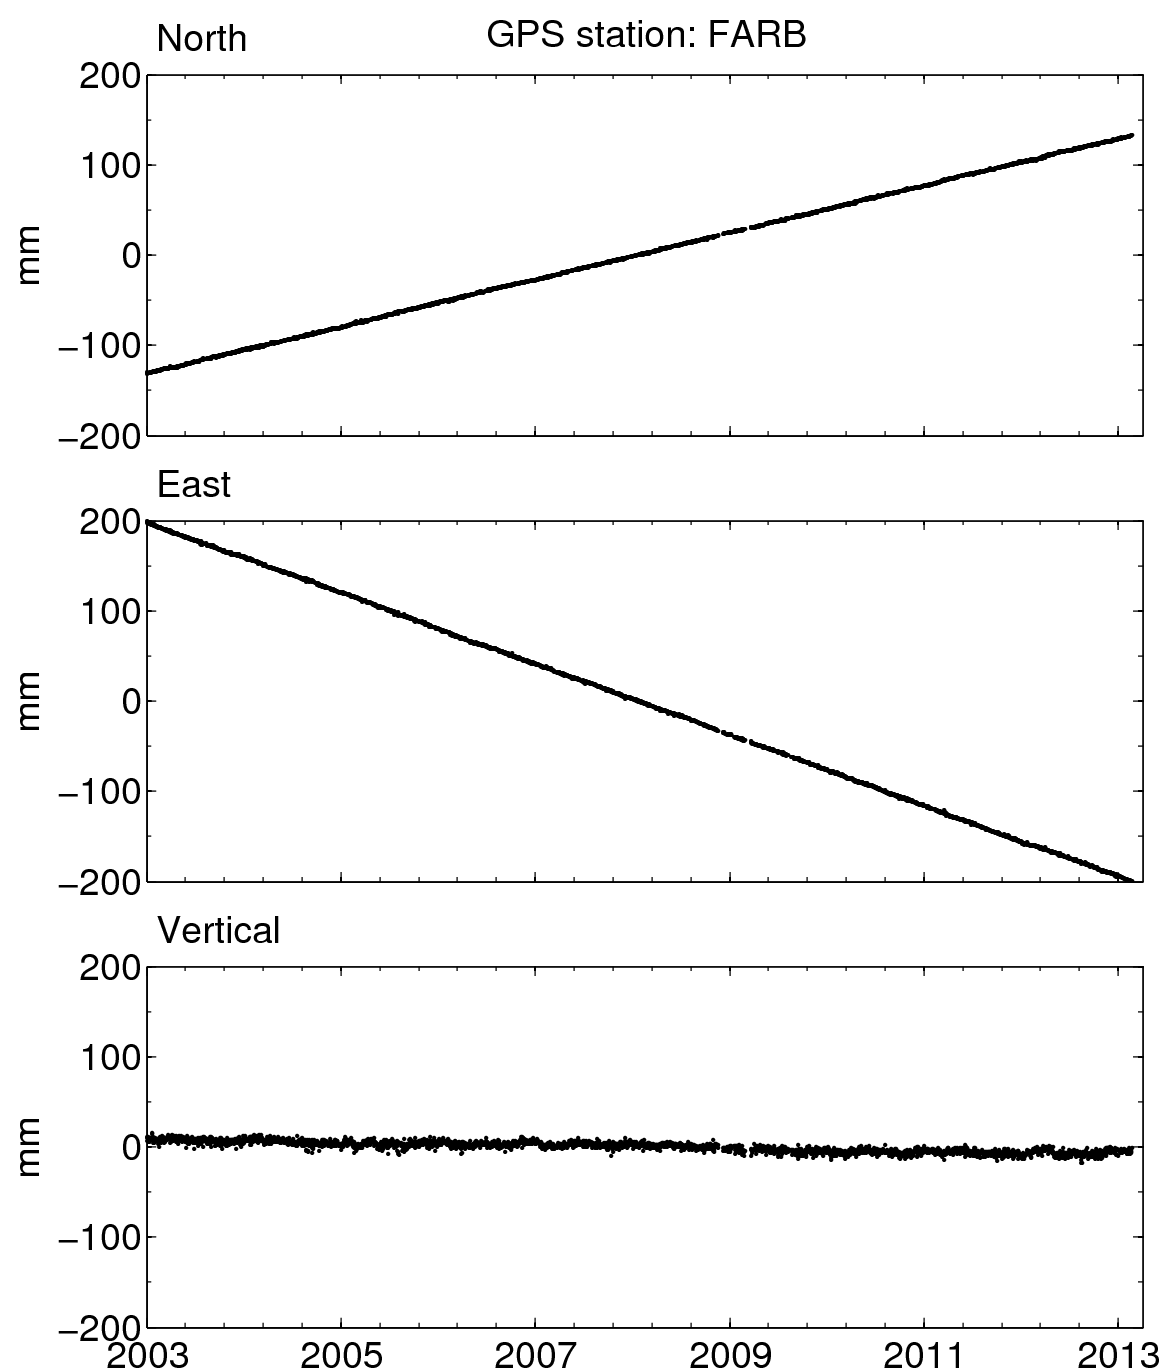
Station FARB is moving northwest at a rate of 46 mm/yr (relative to North America). The time series in Figure 1 is a very straight line, which indicates that FARB is moving slowly and steadily all the time, as is expected from steady tectonic plate motion. However, measurements from other Pacific plate sites, like Hawaii, show that the plate is moving at 50 mm/yr relative to North America. So why is FARB slower?

FARB is slower than other sites on the Pacific plate because it is being held back by the San Andreas Fault. The tectonic plates move past each other constantly, but faults only move during an earthquake. At other times they are stuck and the crust around them must warp to accommodate the motion of the tectonic plates. The slower motion of FARB tells us that it is located within this warped zone around the fault.

Understanding the extent and pattern of deformation in the warped zone tells us how deep the seismogenic, or earthquake-producing, portion of the fault goes and how much stress is loading the fault, which will later be relieved in an earthquake.

Figure 1. Position changes for FARB in a North American reference frame. (For help interpreting the graphs, see the GPS Data page.)


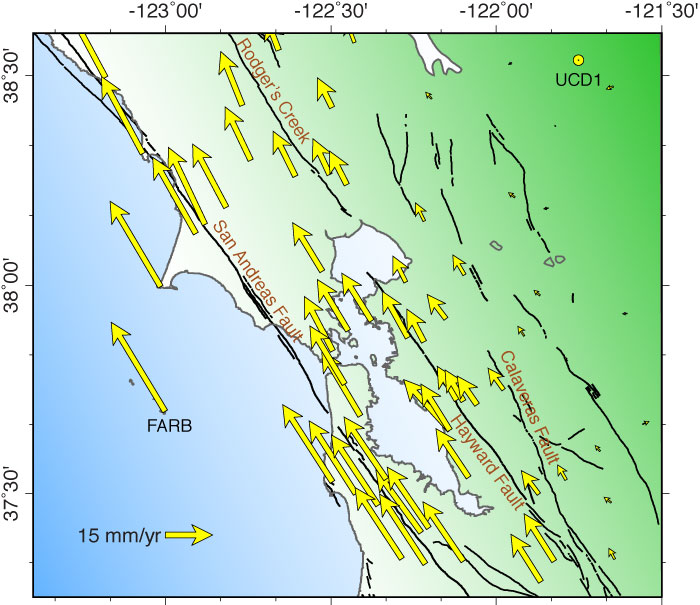
Figure 3. The vectors show the size and direction of motion of GPS sites throughout the Bay Area. These motions are relative to station UCD1, located on the UC Davis campus in the Central Valley. Note how the vectors slowly get longer as you go further west.


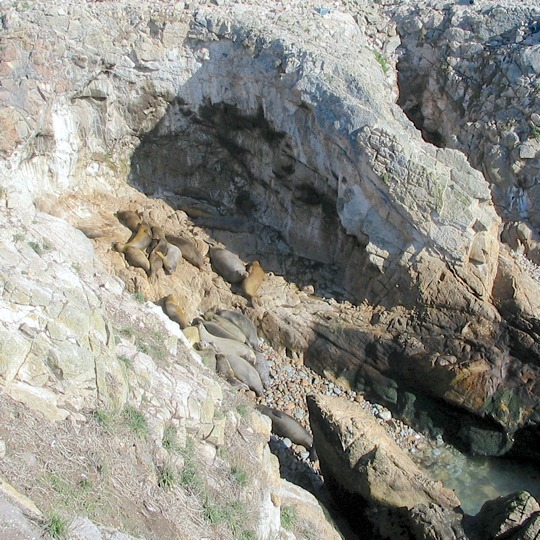
Figure 5. Wildlife protected by the Farallon National Wildlife Refuge snooze nearby.


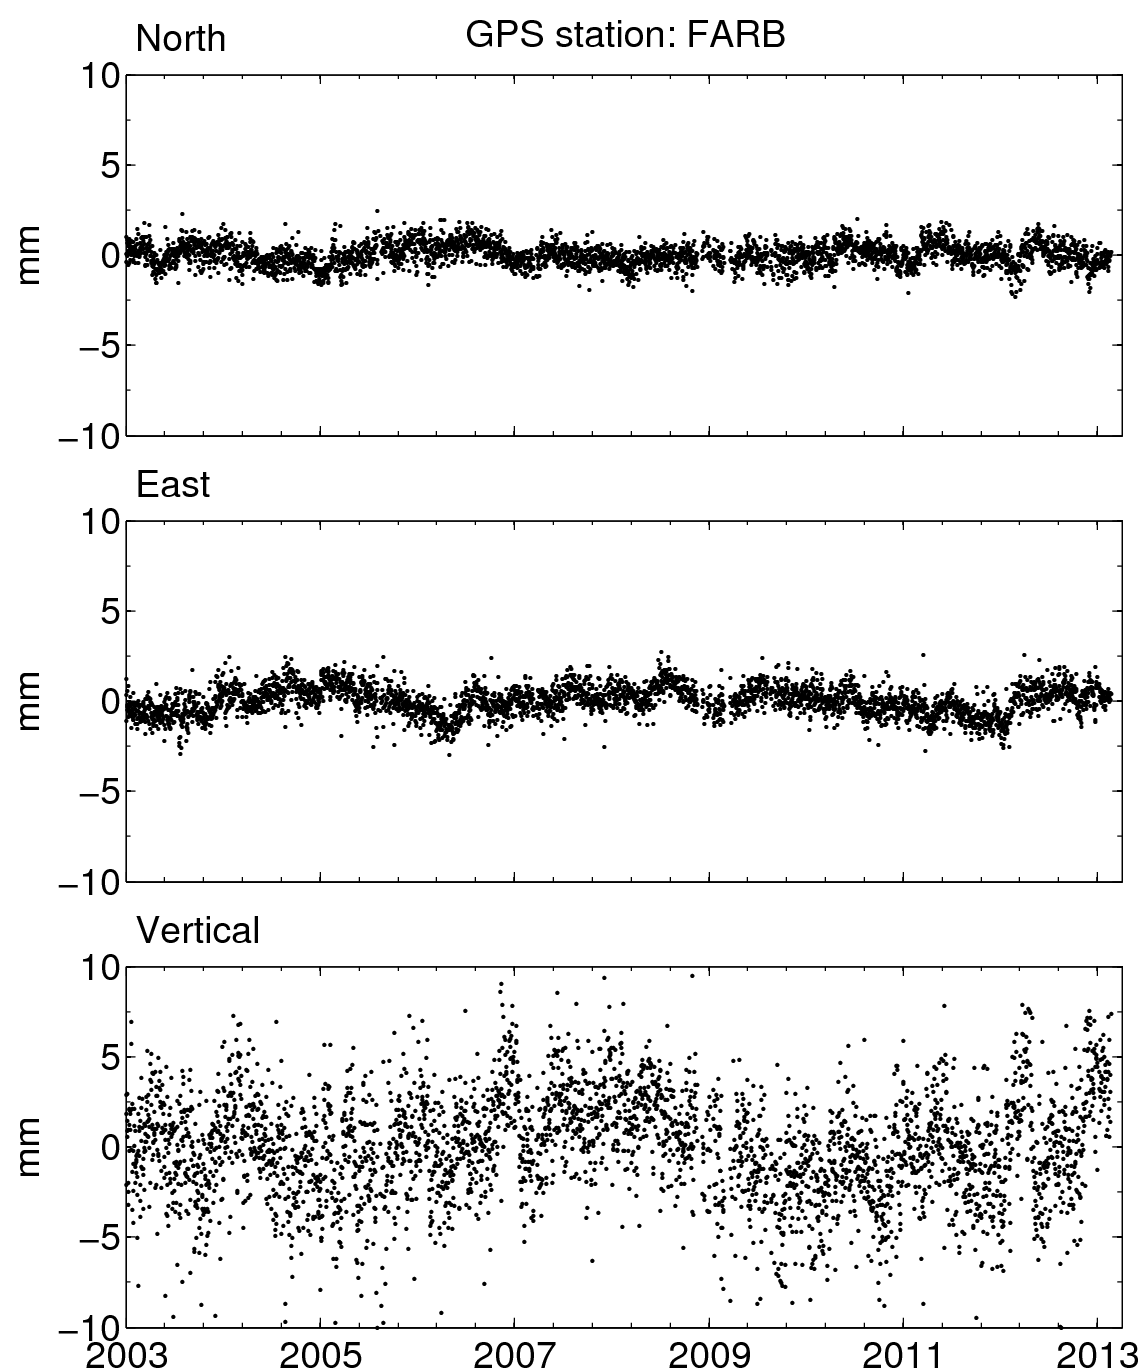
Figure 2. This figure shows what's left over (residuals) after removing a straight line from the FARB time series. The small size of these residuals (about 2 mm) shows just how constant FARB's motion is.


Figure 4. Berkeley Seismo Lab engineer John Friday gets ready for the helicopter flight to the Farallon Islands to perform site maintenance.

Spotlight Questions

  • Look at Figure 1. What is FARB's rate of motion? What plate is FARB on?
  • Why are stations east of the San Andreas Fault also moving northwest (relative to North America)?
  • Which direction will FARB move if there's an earthquake on the San Andreas Fault? Which direction will GPS sites east of the San Andreas move?

Last modified: 2019-12-26  16:24:56  America/Denver  


Please send comments and corrections to educationunavco.org.

Copyright © 2012 - 2025 UNAVCO and the GPS Reflections Research Group.
All Rights Reserved.

Funding and Acknowledgements.