Science Spotlight

Station AC17


Researcher: Ronni Grapenthin
New Mexico Tech

I became a geophysicist because I wanted to combine my interests in computer science, data analysis and the outdoors.


Site AC17, looking southwest, with Mount Redoubt in the background. (Photo: Max Enders, UNAVCO)


Name: DRIFTRIVER
State: AK
Country: United States
Elevation: 882.1 m
Lat/Long:  60.6639 / -152.4038

Eruption of Mount Redoubt

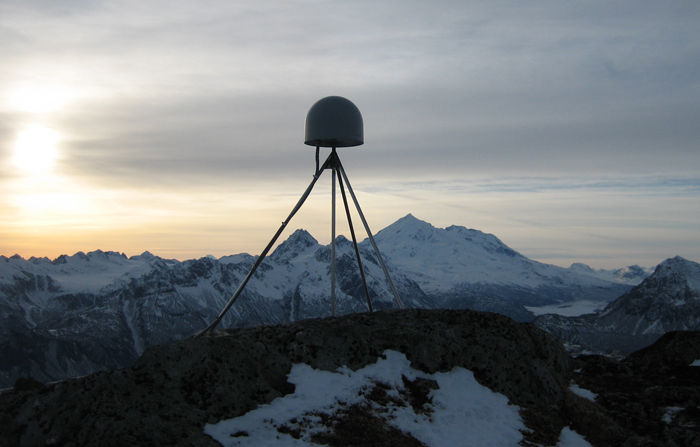
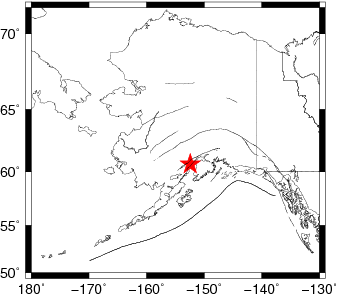
AC17 was installed to measure subduction zone deformation, but the station also happens to be just 28 km northeast of the summit of Mount Redoubt. Redoubt erupted from March 23 to about mid June in 2009. AC17 was the only GPS instrument near the volcano recording continuously during the months prior to the eruption.

Although scientists didn't recognize it at the time, the station's data reveals subtle motion outward from the volcano beginning as early as May 2008, over one year before the eruption. At the beginning of this period, there was no associated earthquake activity, making GPS the first instrumentation to detect activity at the volcano.

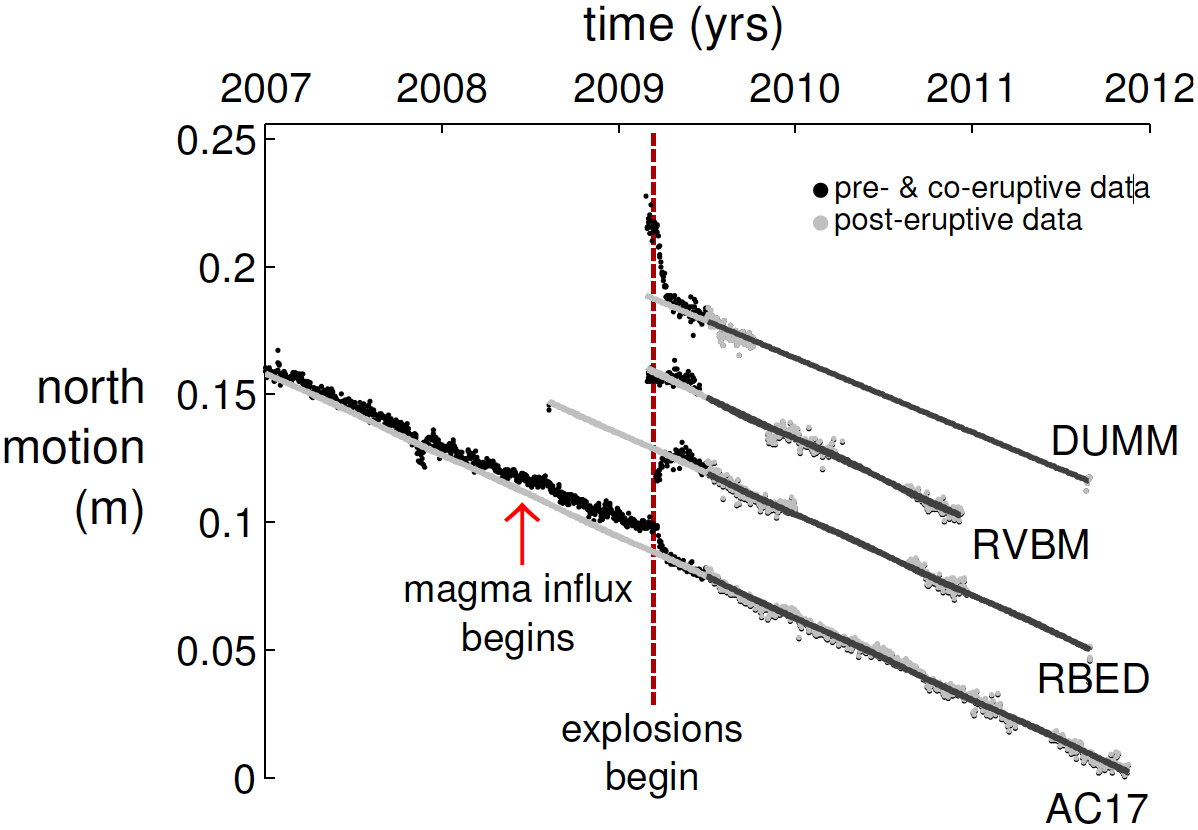
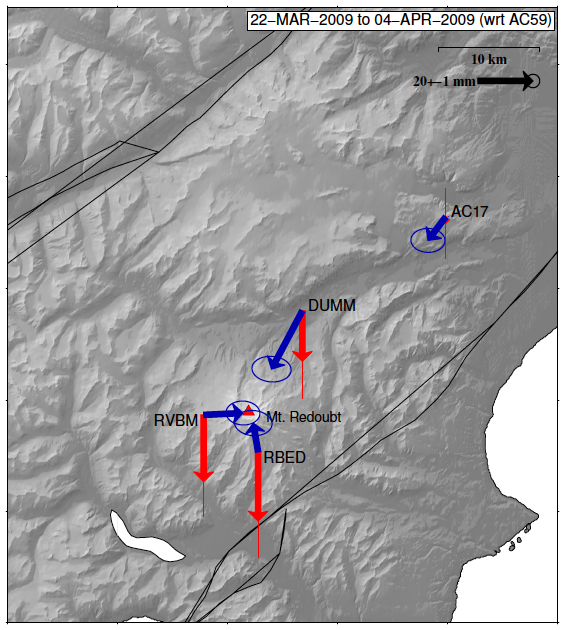
When the eruption began, the motion of AC17 reversed (Figure 3). We link the inflation, the motion leading up to the eruption, to an intrusion of magma, filling the reservoir feeding the volcano. We link the deflation during the eruption to the "evacuation" of material from the magma reservoir.

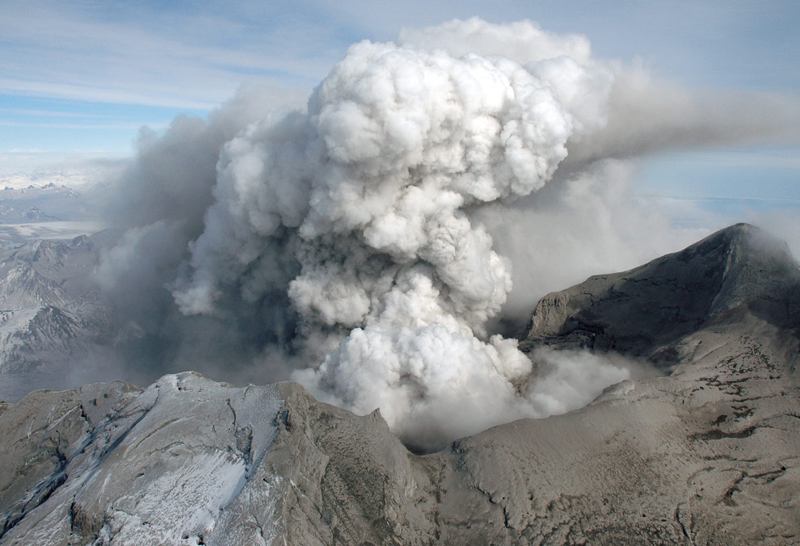
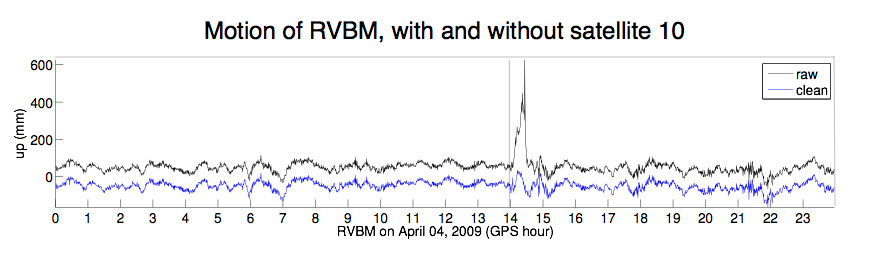
Looking closely at the satellite data provided a possible new way to use GPS in volcano monitoring. When we looked at the records of the closer GPS stations, which were installed just prior to the eruption, we found evidence of ash plumes in the data. For example, when we plot site RVBM's position over the course of the day, we see that it seems to move significantly during the explosions from 14:00 to 14:40 UTC (Figure 5). Why does the site move? It turns out that it doesn't. We found that the plume affects the GPS radio signal, effectively slowing it down and making the site look like it's moving. In the future we hope to use this in near real time volcano monitoring.

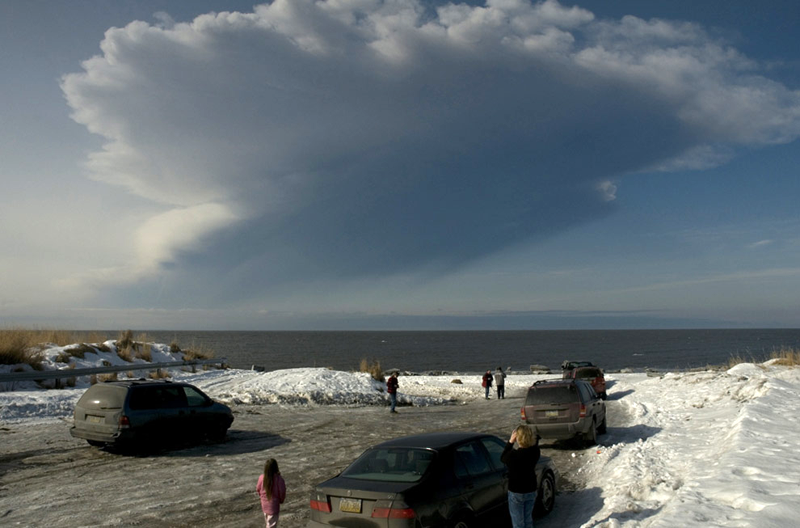
For the video story of a plane's encounter with Redoubt's ash during the 2009 eruptions, see Frontier Scientists' Redoubt's Ash. For more information see the USGS Alaska Volcano Observatory website and the National Weather Service's Mt. Redoubt page.

Figure 1. An explosive eruption at Redoubt on March 31, 2009. (Photo: Game McGimsey, Alaska Volcano Observatory)


Figure 3. North motion of continuous GPS stations at Redoubt volcano from 2007-2012 (in ITRF 2008). Sites DUMM, RVBM, and RBED were operating only for the time of unrest. By drawing long-term trends based on motion after the eruption, we can see a subtle deviation in AV17 beginning about May 2008. Precursory seismicity was detected in December 2008. With the onset of explosions at the end of March 2009, this motion reverses. We can also see that, while the post-eruptive fitted line (dark grey) goes through the points from mid 2009-2012, the light grey line is below the dots from 2007-May 2008. This means that more material came out than what went in.


Figure 5. Position changes for site RVBM on April 4, 2009. The black line is the original calculation, using all available satellites. Note the spike from 14:00 to 14:40 GPS time. Is it motion? When researchers removed satellite 10 from the data processing (blue line), the spike went away. The signal from satellite 10 was delayed travelling through the volcano's plume. Scientists may be able to use this information to remotely and quickly detect ash plumes.


Figure 2. The ash cloud from an explosive eruption at Redoubt on March 28, 2009. (Photo: Jacob Buller, Alaska Volcano Observatory)


Figure 4. Deflation during explosive eruptions from March 22, 2009 to April 4, 2009. Blue arrows show horizontal motion and red arrows show vertical motion during that time period. We can see clear subsidence (deflation) as well as horizontal motion towards the volcano. The blue vectors point toward the source of motion directly under Redoubt Volcano. This helps scientist map out where the magma chamber is.

Spotlight Questions

  • What is the linear trend in Figure 3 related to?
  • With only pre-eruptive data, could we have detected the deviation beginning in May 2008? Why or why not?

Last modified: 2019-12-26  16:24:58  America/Denver  


Please send comments and corrections to educationunavco.org.

Copyright © 2012 - 2024 UNAVCO and the GPS Reflections Research Group.
All Rights Reserved.

Funding and Acknowledgements.