Science Spotlight

Station SG05


Researcher: Junhong (June) Wang
University at Albany, SUNY

Professor Wang releasing a weather balloon.


The SG05 GPS receiver is hosted by the Florida Institute of Technology.


Name: Melbourne
State: FL
Country: United States
Elevation: -10.0 m
Lat/Long:  28.065 / -80.6228

Tropical Storm Fay

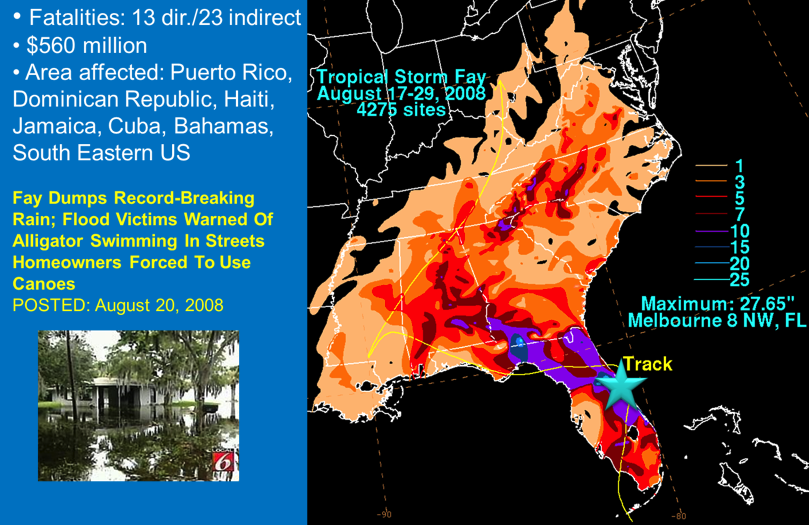
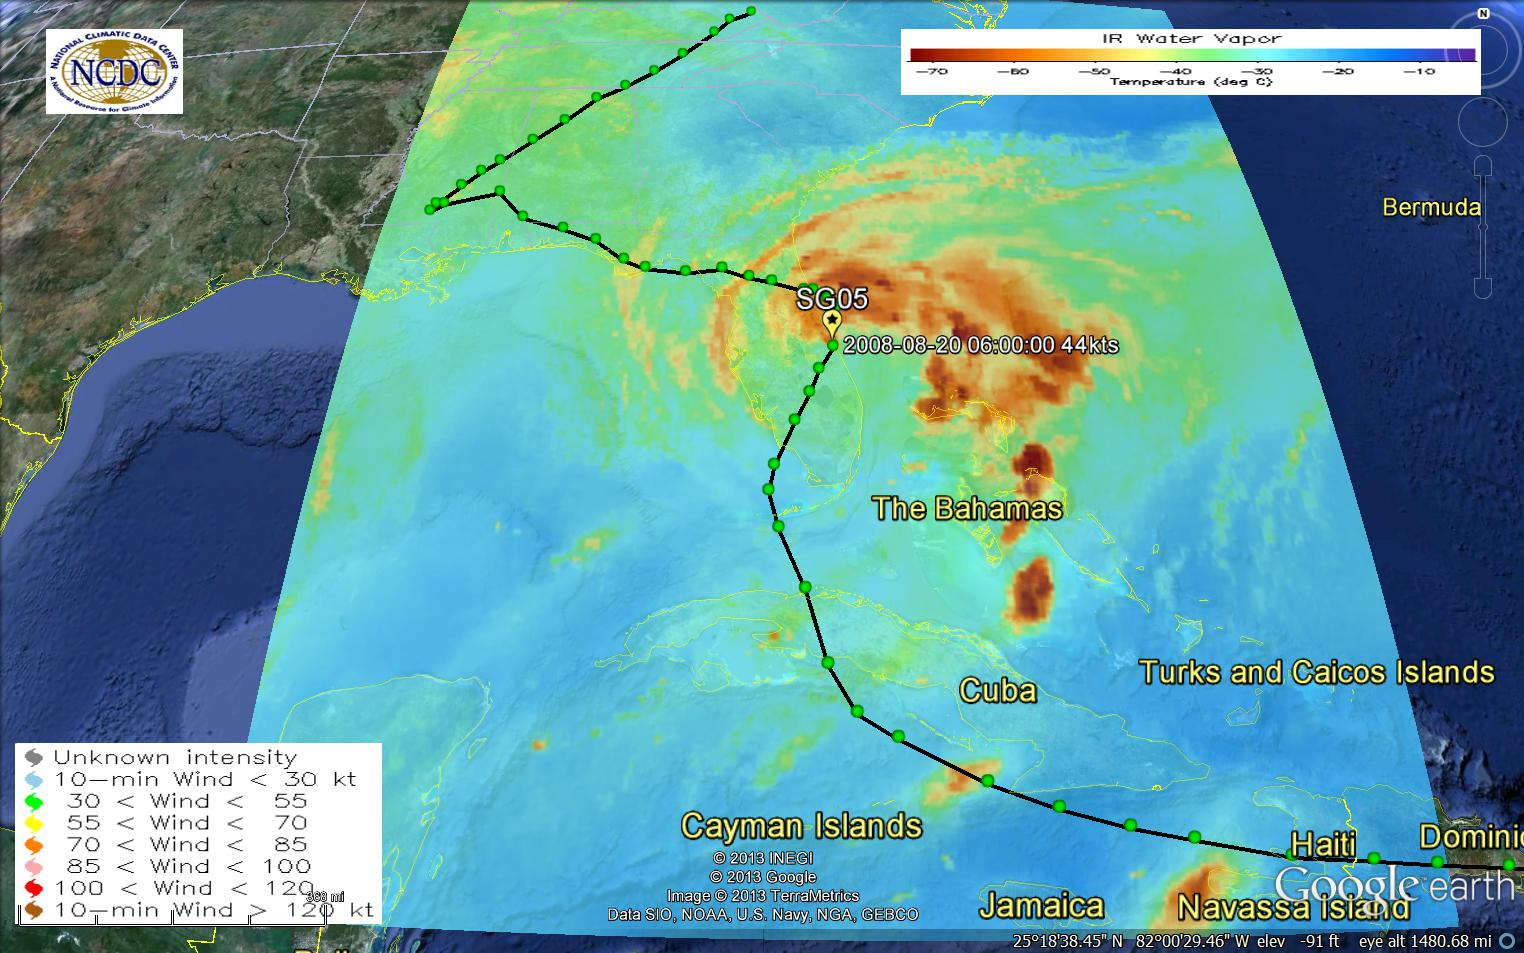
Tropical storm Fay lasted from Aug. 17 to 29, 2008 and affected a large geographic region including Puerto Rico and the southeastern region of the United States (Figures 1 and 2). Fay dumped record-breaking amounts of rain, with a maximum of 27.65" near Melbourne, Florida. The tropical storm passed the SG05 GPS site at 6 UTC on August 20, 2008.

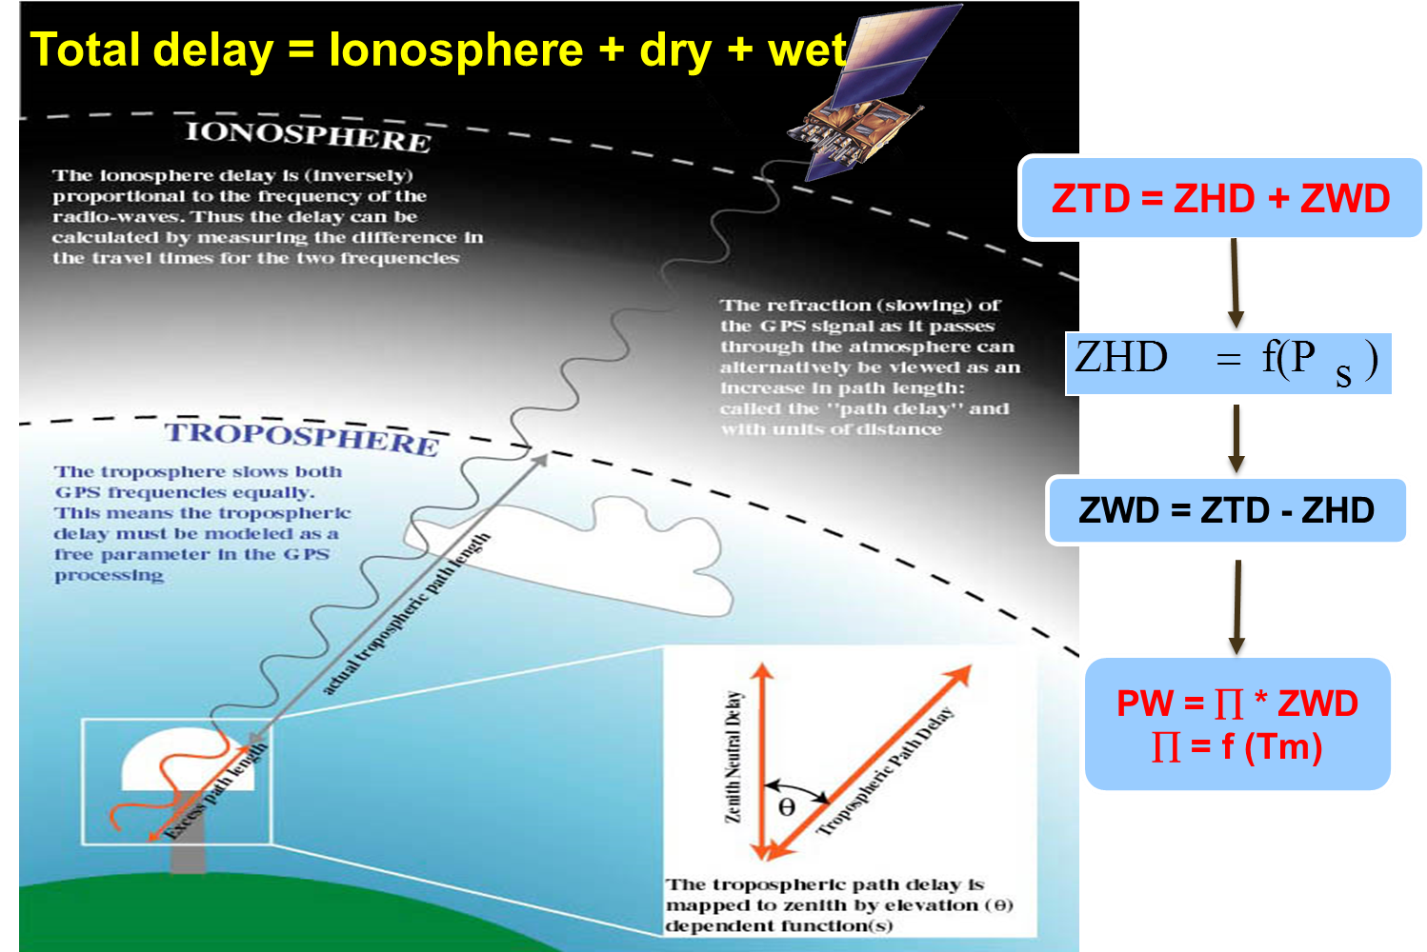
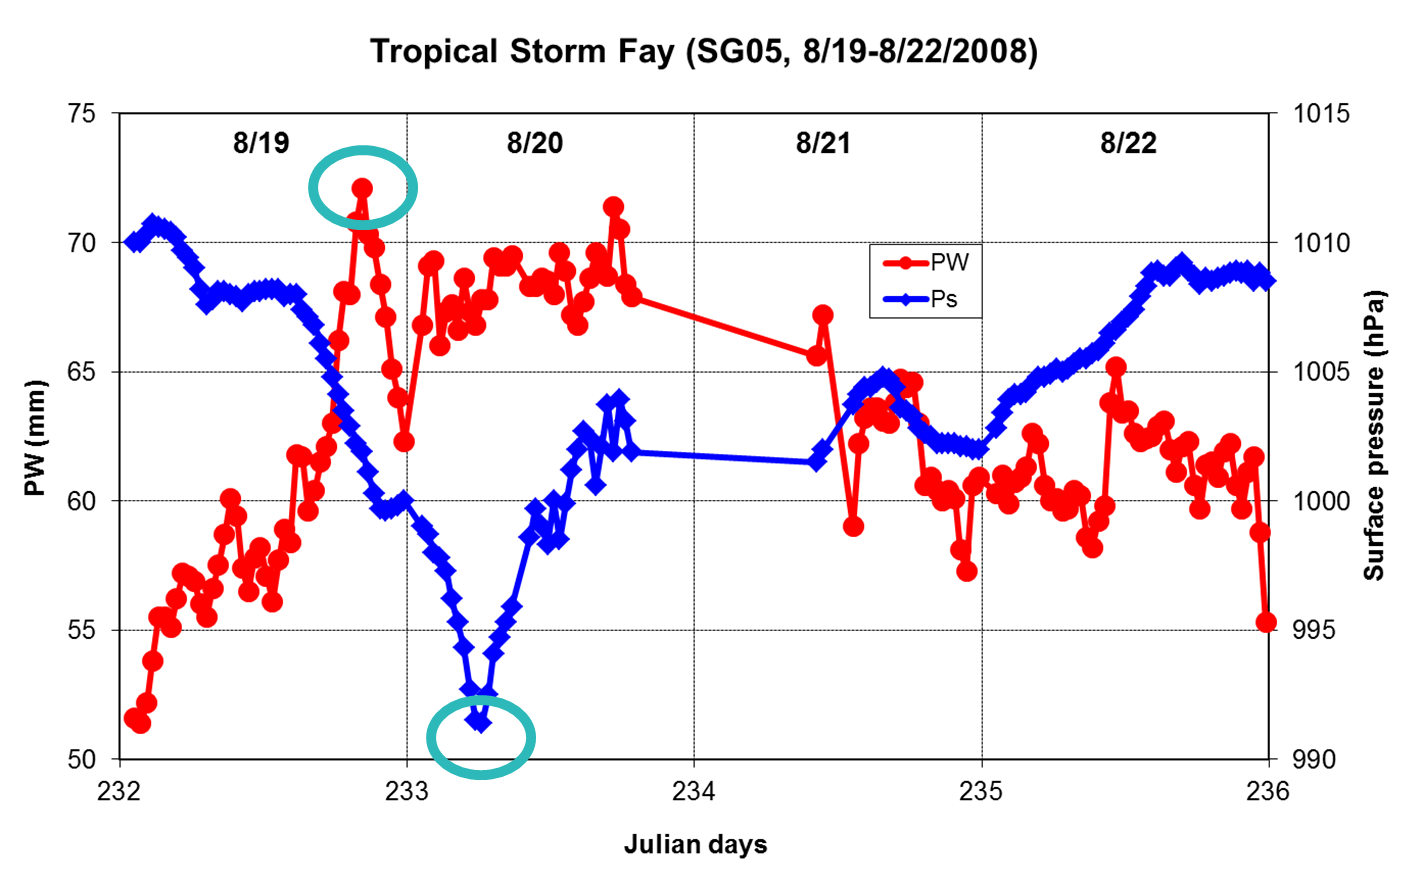
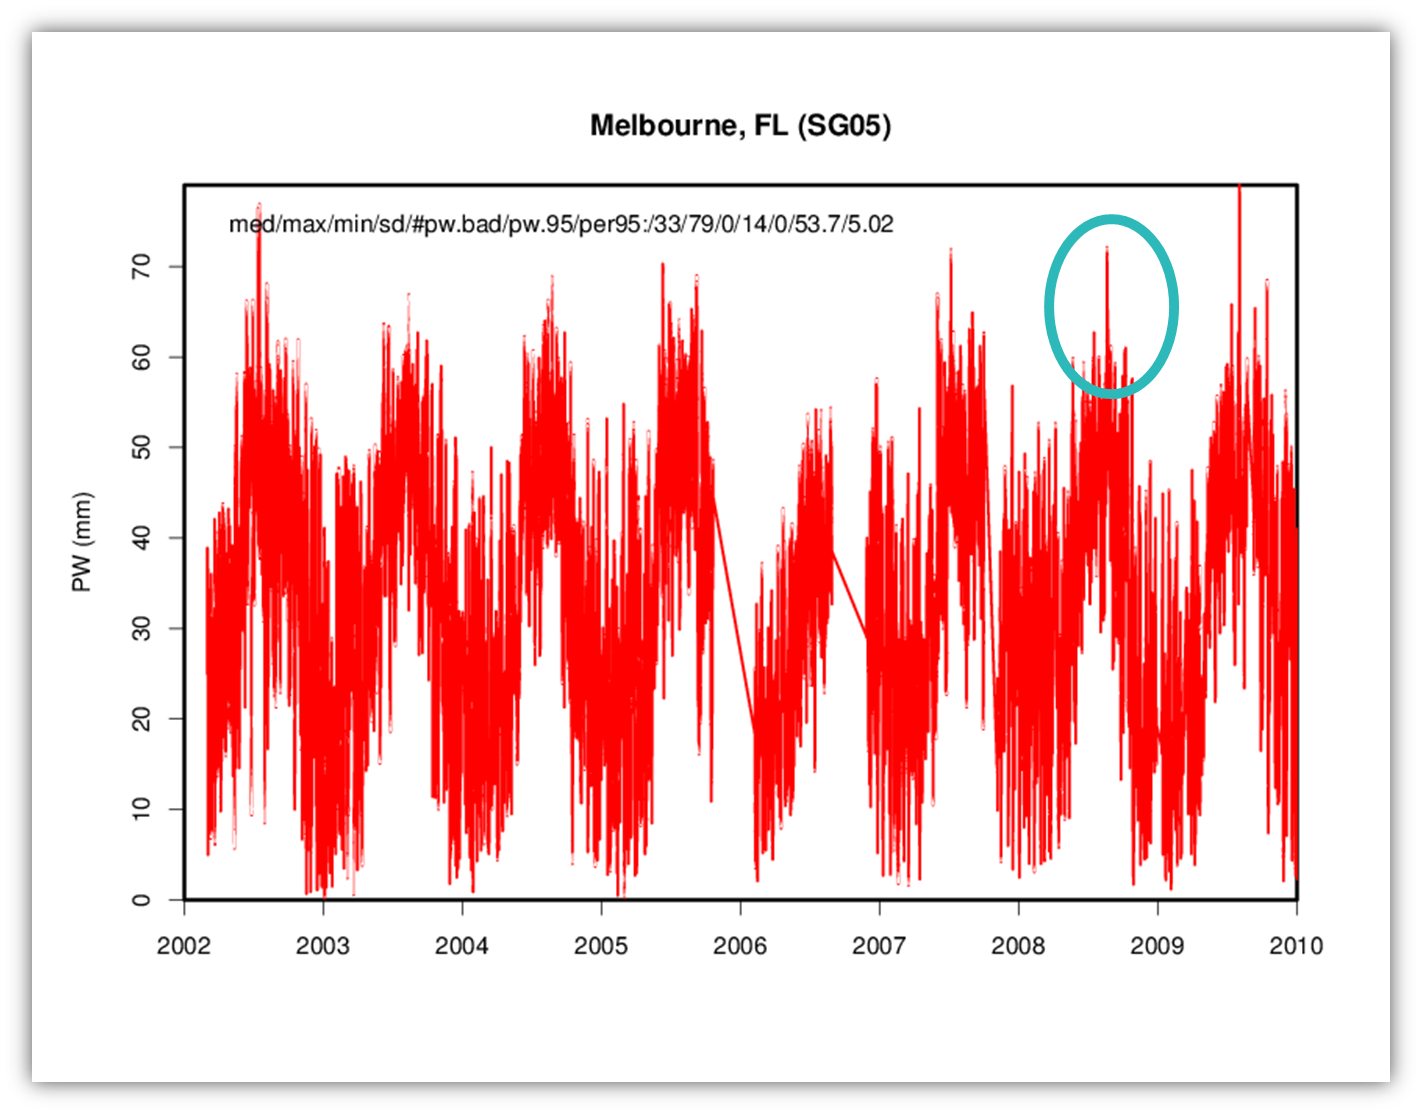
Water vapor is the most abundant greenhouse gas on the planet, yet it is the least accurately measured globally. The propagation of GPS signals through the atmosphere can be used as a way to measure precipitable atmospheric water vapor, or PW (Figure 3). Other methods include radiosonde (attached to weather balloons and launched twice per day) and satellite observations. GPS has supplemented these methods with its high temporal resolution (up to every 5 minutes), accuracy, and availability under all weather conditions, such as hurricanes. Figure 4 shows GPS data collected at SG05 from 2002 to 2009. It clearly shows that there was particularly abundant water vapor in the summer of 2008. The zoomed in view of the data from August 2008 shows the peak value of PW before the storm came in at 6 UTC when the surface pressure dropped to the lowest point (Figure 5).

Figure 1. The left panel shows the rain fall maps as a result of Tropical Storm Fay. The right panel summarized the impact of the storm from the news media.


Figure 3. Schematic plot showing how GPS measures atmospheric precipitable water (PW). GPS satellites transmit radio signals that are delayed by the atmosphere, which makes it seem to have a longer length. The ionosphere delay is removed by using two GPS frequencies. The troposphere delay is modeled to the vertical direction, or zenith tropospheric delay (ZTD). This combines the hydrostatic and wet delay (ZHD and ZWD). ZHD is removed by measuring the atmospheric surface pressure, leaving PW.


Figure 5. Time series of 30-min GPS PW (red) and surface pressure (blue) during Hurricane Fay.


Figure 2. The map shows the tracks of Tropical storm Fay (black line). It reached SG05 site at 6 UTC on August 20, 2008 with a surface wind of 44 knots. The background image is the satellite infrared image. (created from NOAA/NCDC Hurricane Satellite Data).


Figure 4. Time series of 30-min PWs from 2002 to 2009 at SG05 (data courtesy of Suominet).


Last modified: 2019-12-26  16:24:50  America/Denver  


Please send comments and corrections to educationunavco.org.

Copyright © 2012 - 2024 UNAVCO and the GPS Reflections Research Group.
All Rights Reserved.

Funding and Acknowledgements.