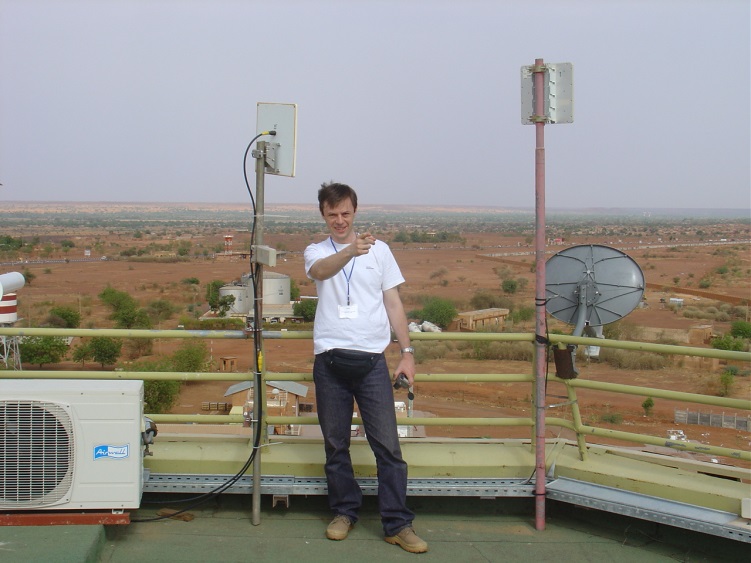
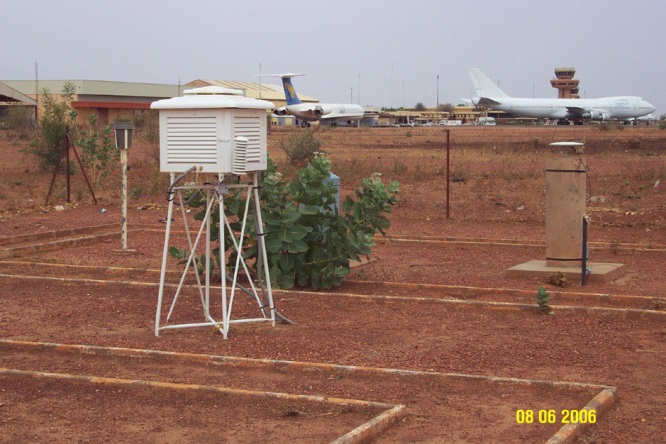
The NIAM GPS site was installed to support measurements of the atmospheric water cycle in West Africa in the framework of the
AMMA project. It is one of the six stations installed by AMMA scientists in 2005 and 2006 for monitoring the temporal variability of the integrated water vapor. Water vapor plays an important role in many atmospheric processes and especially in the water cycle. Improving our understanding of the mechanisms controlling the development of thunderstorms and the relationships between moisture and precipitation, and improving our capability to predict more accurately the amount of rainfall and location of rain events were major objectives of AMMA. The amount of moisture in the atmosphere is indeed one of the key factors controlling the development of thunderstorms and determining the quantity of rainfall produced each year during the monsoon season in West Africa.
NIAM is located in Niamey, Niger, at the fringe of the Sahara, in a region called the
Sahel, where more than 90% of the annual rainfall is due to large thunderstorms occurring during a short period of time, the so-called monsoon season or rainy-season. The monsoonal rainfall is vital for the Sahelian populations as it represents the primary source for groundwater in a region where pumping by the human and withdrawal by the vegetation almost dries out the underground water stocks every year.
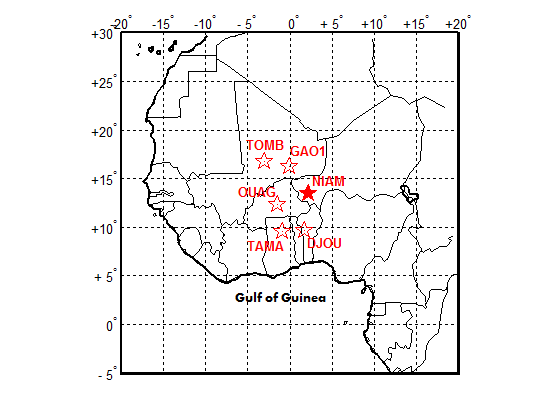
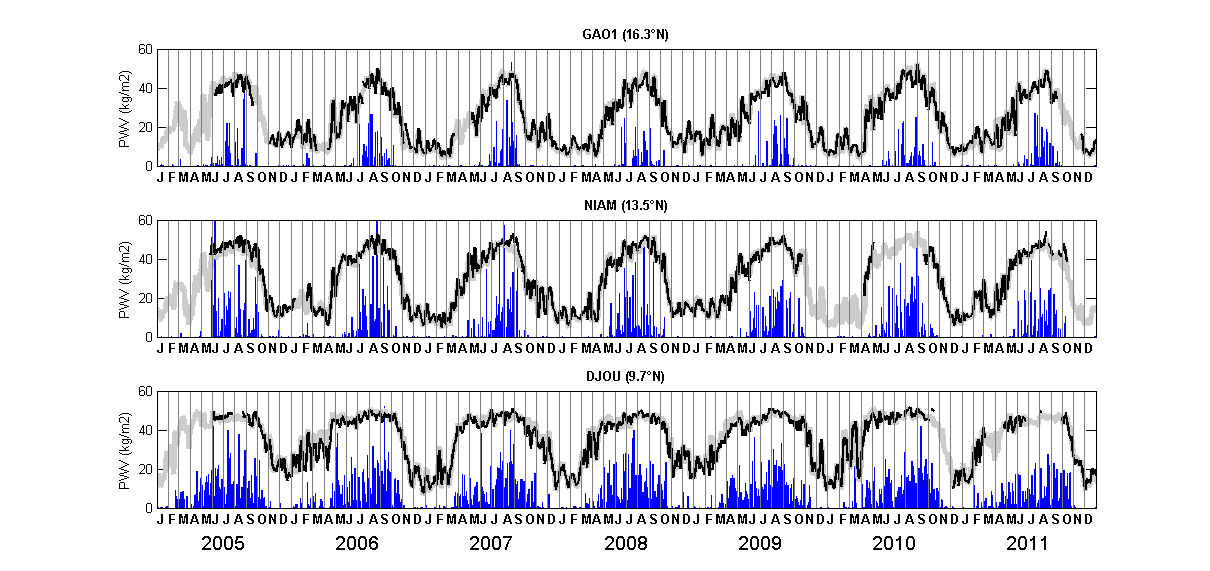
Figure 1 shows precipitation estimates provided by the GPCP merged product using data from satellites and surface rain gauge networks at NIAM and two other sites, one in the north of the Sahel (GAO1, located in Gao, Mali) and one to the South, in a more humid forested region (DJOU, located in Djougou, Benin). It is seen that the rainy-season in Niamey extends usually from June to September, with some occasional rainfalls in May and in October. In Gao and more to the north, the rainy-season gets shorter as one approaches the Sahara desert where no rainfall is observed throughout the year. In Djougou and more to the south, the rainy-season is longer and more intense as one moves towards the Gulf of Guinea where most of the moisture comes from during the rainy-season.
Figure 1 also shows integrated water vapor (IWV) data from GPS and the European weather forecast model known as
ECMWF. Both data sets show overall good agreement at this rather broad timescale. As a first result, the GPS measurements help here to evaluate the quality of the atmospheric model in a region of the World where very few observations are available and where the weather models have large uncertainties. But the most interesting result shown by Figure 1 is the relationship between the annual variations in water vapor and precipitation. At all three sites, the rainy-season is imbedded within a broader period of high water vapor contents. It appears that rainfall occurs mainly when the IWV values are above 35-40 kg m-2, which means that the atmosphere needs to be very moist (and unstable) to develop convective storms producing significant rainfall. One can also notice the extremely large excursion of IWV between the dry season (November to March in Niamey) and the wet season (April to October). These features are qualitatively found at all three sites but with some differences in the dates of start and durations of the seasons depending on the location of the site in between the Gulf of Guinea and the Sahara. A transect of only three GPS sites such as in Djougou, Niamey, and Gao provides thus a nice overview of climatic features of the region.
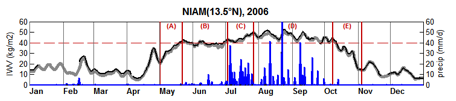
Figure 2 shows that IWV can reveal many more, significant, intermediate states of the atmosphere within a single annual cycle. From here we can define the dry (respectively the moist) season as the period when IWV is and remains below (above) 20 kg m-2. Based on IWV, the moist season can now be subdivided into five phases: (A) a period of increase in IWV characterizing the arrival of moist air from the Gulf of Guinea which marks the end of the previous dry season; (B) a period of stationary IWV where the air is moist but almost no rainfall is recorded; (C) a transition to larger moisture contents coincident with the first rainfalls, so-called the monsoon onset; (D) the main rainy season with sustained rainfall but also some fluctuations, referred to as intra-seasonal variability ; the rainfall fluctuations appear to coincide with fluctuations in IWV; (E) the decrease in IWV and stop of the rainfall (so-called monsoon retreat). A very similar picture could be drawn from the GPS measurements collected at the other sites but with different dates of start and durations of the periods depending on the latitude of the site (not shown). Very specific atmospheric processes are active within each of these phases. We shall illustrate just one below.
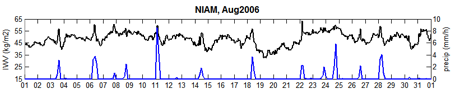
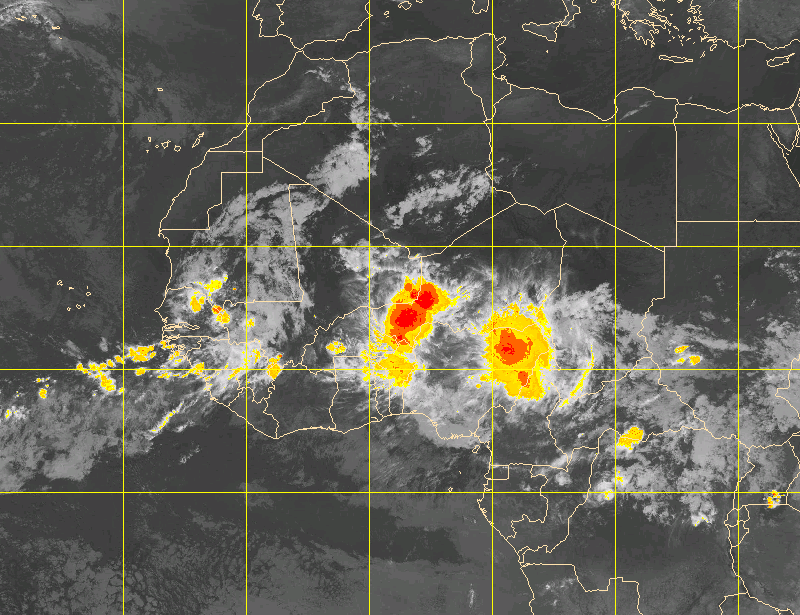
Figure 3 shows a time series of high temporal resolution for IWV and precipitation from GPS data and the TRMM satellite product. Most peaks in the precipitation series correspond to the passage of a single or an organised ensemble of thunderstorms. These thunderstorms provide unequal yield of rainfall. The amount of observed rain on the ground depends actually on the size and speed of the thunderstorm and the atmospheric state (dryness/wetness) along its path, among other things. One spectacular event was recorded on 11 August 2006 which reached a rainrate of more than 8 mm per hour. Figure 4 provides a satellite picture of this event at 03 UTC when it passed over Niamey. The picture shows that it is actually a
"squall line" which has a latitudinal extension of approximatelty 1000 km. As most
mesoscale convective systems in West Africa, this squall line propagated westward under the influence of strong wind in the middle and upper troposphere. A ground-based radar measured a speed of 14 m s-1 for this squall line.
The GPS IWV time series in Figure 3 reveals another interesting feature. Almost all the precipitation events recorded near the NIAM GPS site are associated with a short-duration peak in the IWV series. The feature raises an important question: is it a signature of the interaction between the mesoscale convective system and the air in the background or is it an artifact in the GPS measurement in the presence of a large-scale atmospheric disturbance? The physical meaning of the former is that convergence of moisture is preceeding the arrival of the system; whereas moisture is decreasing as the system passes over due to the conversion of moisture into rain. The quantitative answer brought by the GPS measurements would in this case be very valuable for imporving our understanding of the atmospheric processes at play. This is the subject of on-going research.
Note: The unit kg m-2 represents the mass of the water vapor molecules (in kg) in a column of atmosphere which has a footprint on the ground of 1 m-2; if all the molecules would rain out, 1 kg m-2 of vapor would produce a water layer of 1 mm thick over that area of 1 m-2.

 unavco.org.

 Spotlight Map
 GNSS Videos
 Funding and Acknowledgements