Science Spotlight

Station LAR2


Researcher: Matt King
Surveying and Spatial Sciences
School of Land and Food
University of Tasmania


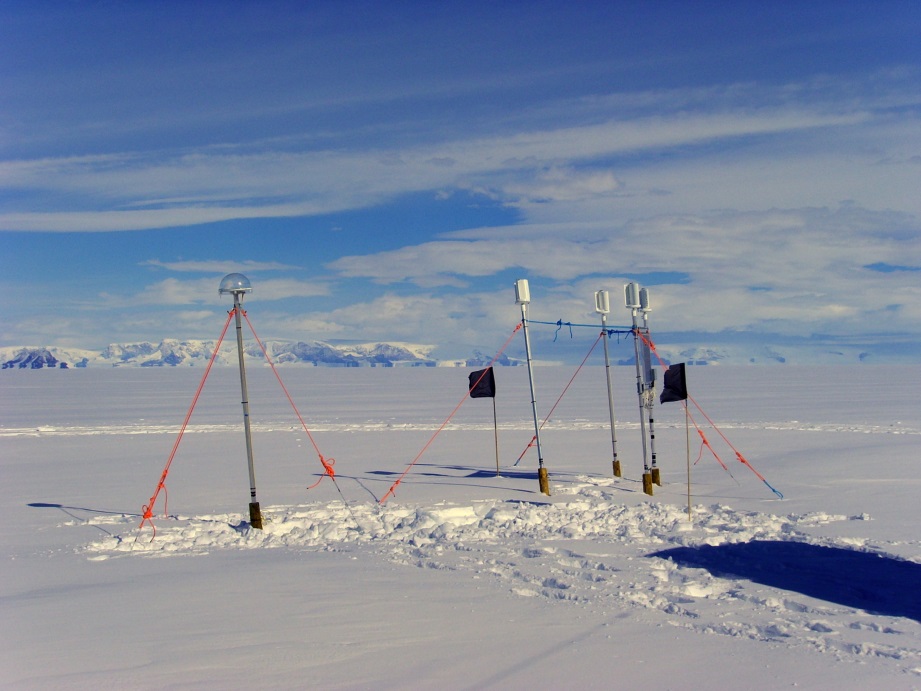
GPS antenna on a pole at site LAR2 alongside wind turbines used to power the GPS receiver. The receiver and batteries are buried in the snow for insulation. Solar panels are also used to power the equipment. The vast flat area in the background is the Larsen C Ice Shelf. All of it is floating and going up and down due to the tides.


Name: Larsen Ice Shelf
State: Antarctica
Country: Antarctica
Elevation: 51.4 m
Lat/Long:  -67.9986 / 295.7184

Tidal movement of Larsen C Ice Shelf, Antarctica

If you live along the coastline, you're used to the regular rising and falling of the sea due to tides. Thanks to a combination of tide gauges along the coastline and satellite measurements of the ocean surface we now have a very good picture of the ocean tides almost everywhere. One of the key places that we don't know much about how the tides vary is in Antarctica. That is important since good tidal predictions are required to correct satellite measurements of Antarctica's changing ice. What's more, it turns out the flow of the ice can also be altered by the tides and measuring the way it responds can tell us something important about how ice flows.

Learn more about tides in Antarctica at this link.

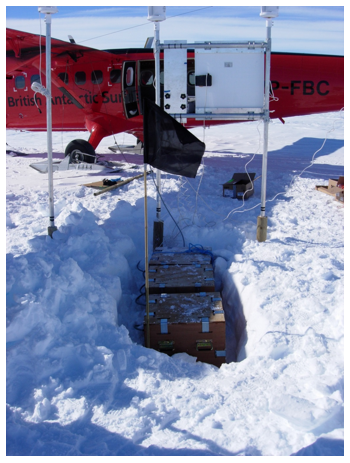
Figure 1. Batteries used to power the GPS through the Antarctic winter (when there is so little sunlight) being buried beneath the snow.


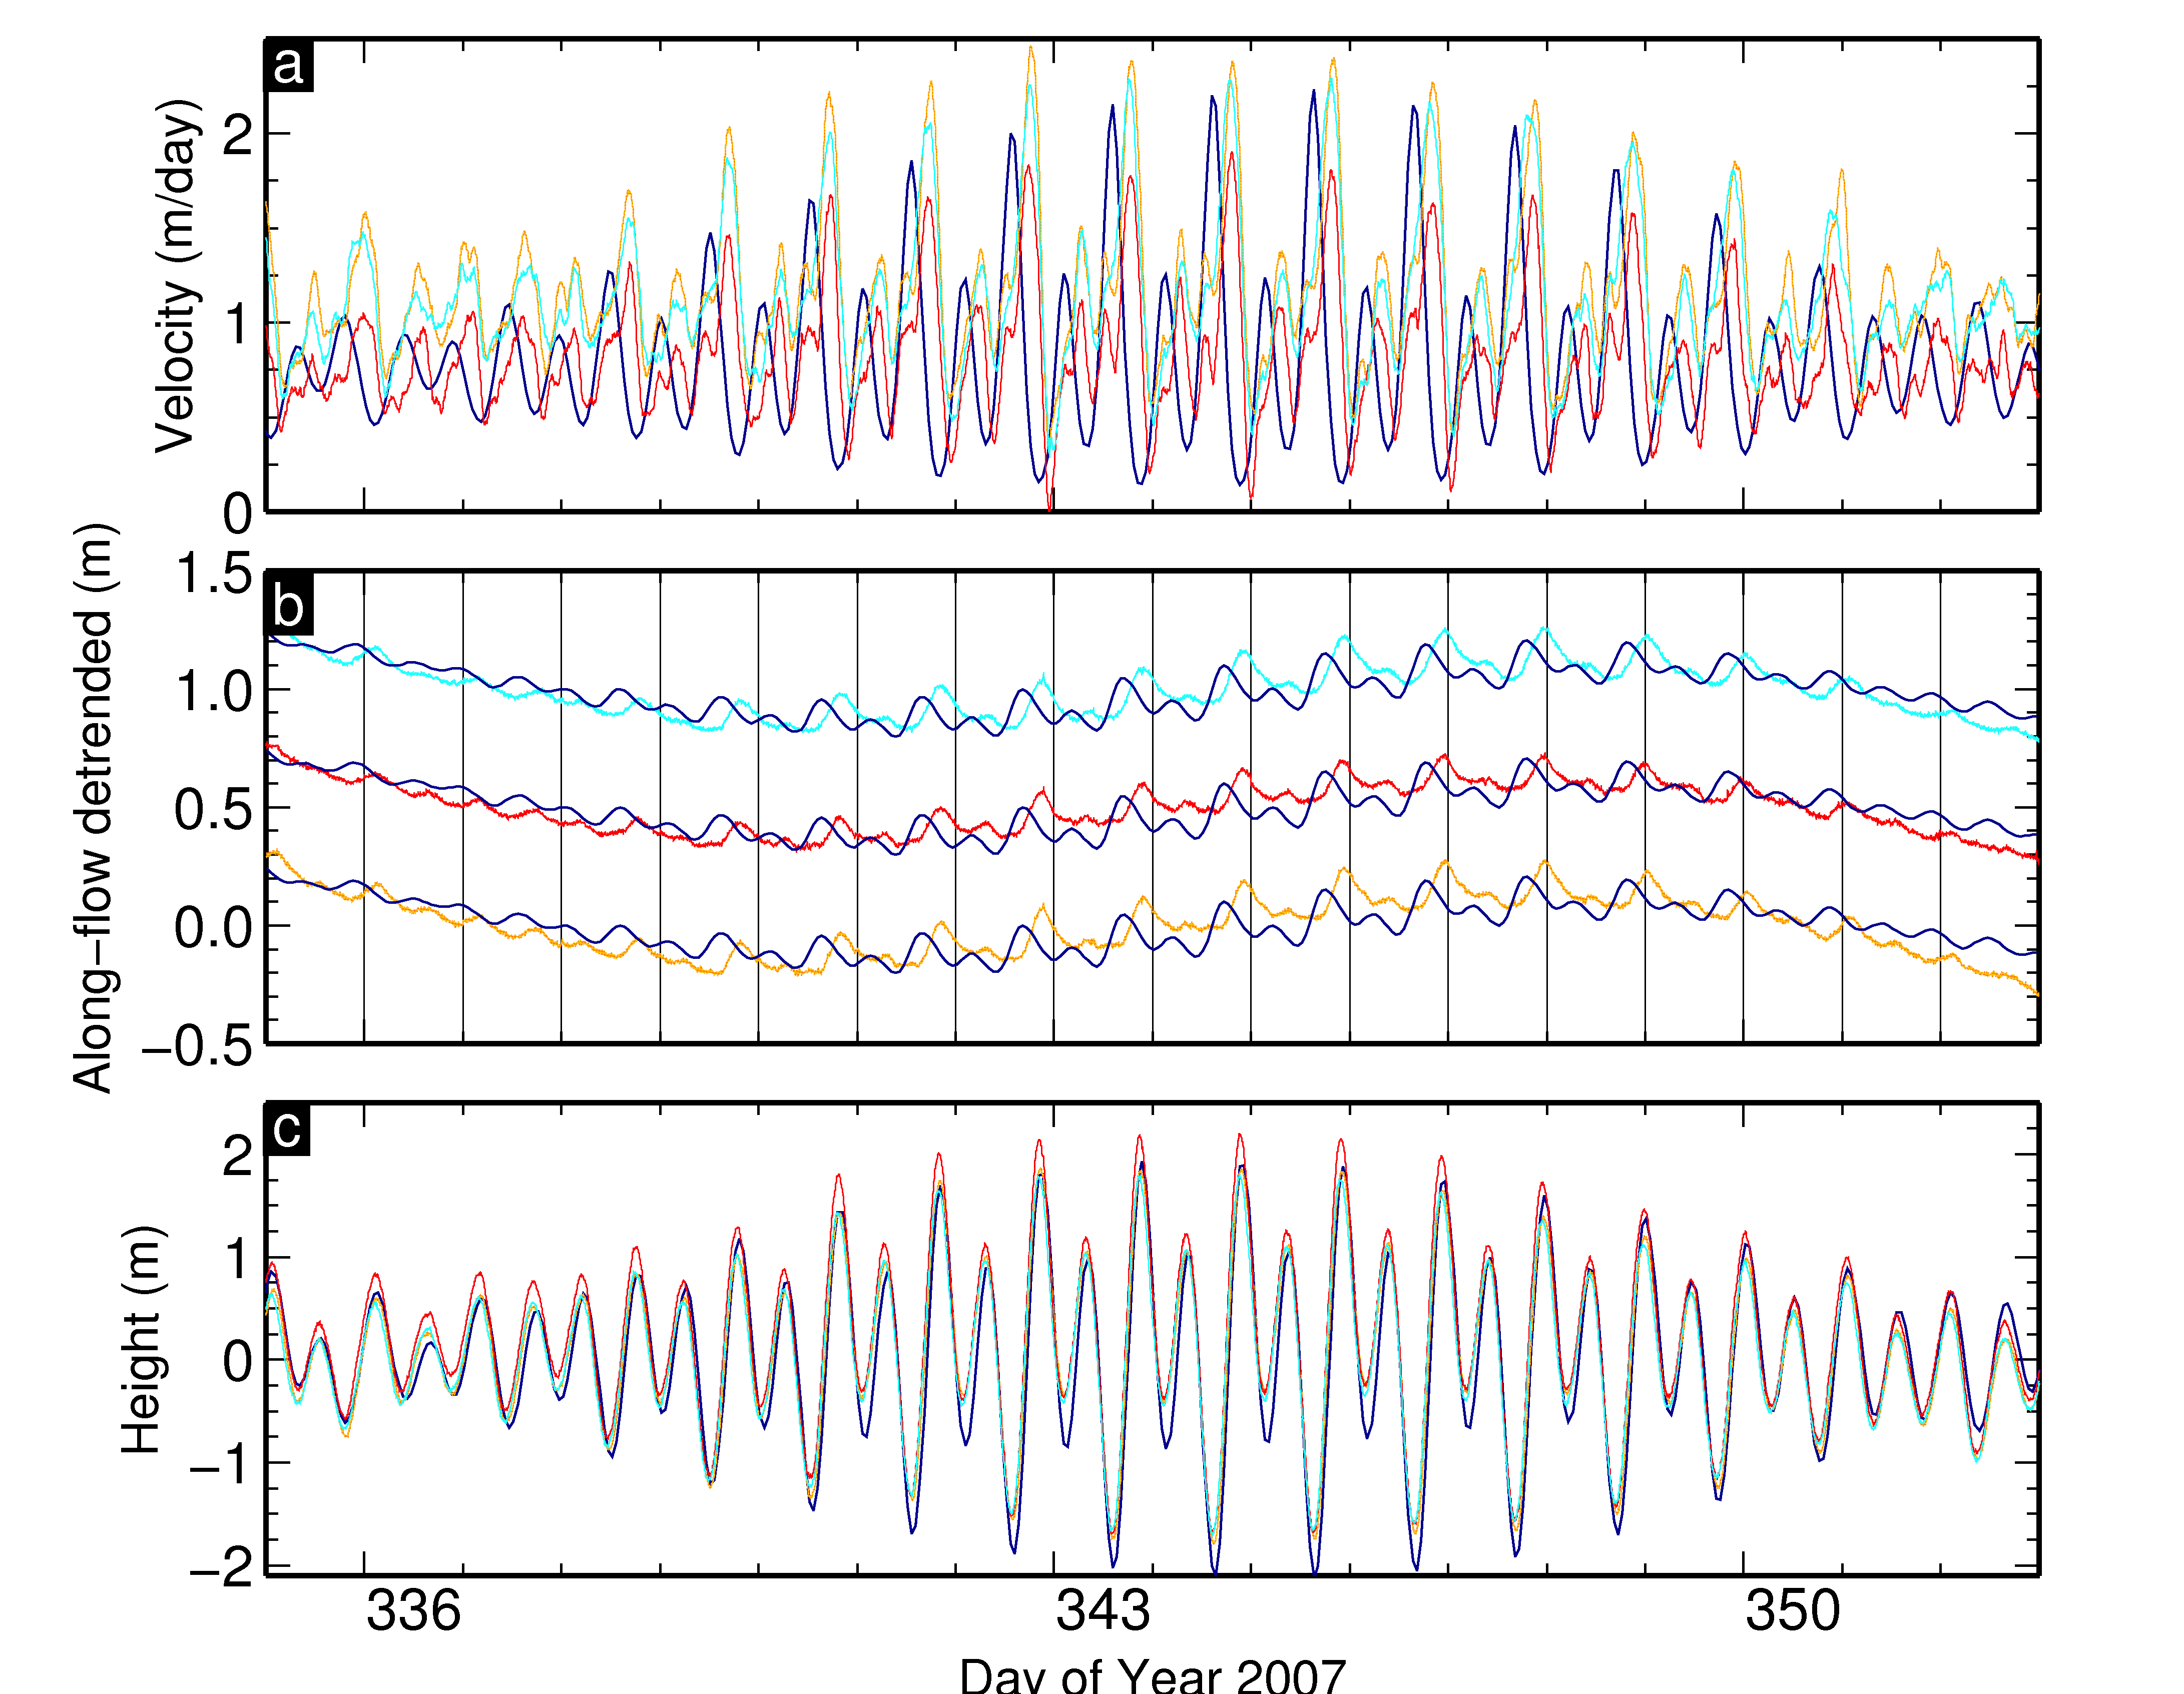
Figure 3. Graphs of the motion of the three GPS sites - LAR1 (orange), LAR2 (red) and LAR3 (light blue) determined every 5 minutes over a two week period. On the bottom panel is the height showing the tidal motion of the sites. The top panel shows the horizontal speed of the sites in metres per day. The middle panel shows the same but in terms of a map of the horizontal site positions. The blue lines are an attempt to replicate the observations - not bad, but not perfect.


Figure 2. Map of the Larsen C Ice Shelf showing its location within Antarctica and the location of the three GPS sites used in this study: LAR1, LAR2 and LAR3.

Spotlight Questions

  1. From the graph, how often do the sites go up and down? Which site has the largest tidal range?
  2. How does the velocity (speed) of the sites vary? Do the fastest speeds correspond to low or high tide (or neither)?
  3. What it the average speed and how far does that mean the ice moves horizontally every year?

Last modified: 2019-12-26  16:24:55  America/Denver  


Please send comments and corrections to educationunavco.org.

Copyright © 2012 - 2024 UNAVCO and the GPS Reflections Research Group.
All Rights Reserved.

Funding and Acknowledgements.